RNAseq processing (1457)
gene_x 0 like s 1075 view s
Tags: pipeline, RNA-seq
-
construct DESeqDataSet from Matrix
library("AnnotationDbi") library("clusterProfiler") library("ReactomePA") library("org.Hs.eg.db") library(DESeq2) library(gplots) library(ggplot2) library(ggrepel) setwd("/home/jhuang/DATA/Data_Samira_RNAseq/results/featureCounts/") #cut -f2- merged_gene_counts.txt > merged_gene_counts_2.txt d.raw<- read.delim2("merged_gene_counts.txt",sep="\t", header=TRUE, row.names=1) colnames(d.raw)<- c("gene_name","TCR9_r3","X1457_r1","mock_r3","M2_r2","delta9H_r1","delta9H_r3","M2_r3","X1457_r2","M10_r3","TCR9_r1","M1_r1","TCR9_r2","M1_r2","X1457_r3","M10_r2","M2_r1","mock_r2","delta9H_r2","M1_r3","mock_r1","M10_r1") col_order <- c("gene_name","mock_r1","mock_r2","mock_r3","M1_r1","M1_r2","M1_r3","M2_r1","M2_r2","M2_r3","M10_r1","M10_r2","M10_r3","X1457_r1","X1457_r2","X1457_r3","TCR9_r1","TCR9_r2","TCR9_r3","delta9H_r1","delta9H_r2","delta9H_r3") reordered.raw <- d.raw[,col_order] reordered.raw$gene_name <- NULL #NOTE that we should d instead of d.raw!!!!!! d <- reordered.raw[rowSums(reordered.raw>3)>2,] condition = as.factor(c("mock","mock","mock","M1","M1","M1","M2","M2","M2","M10","M10","M10","X1457","X1457","X1457","TCR9","TCR9","TCR9","delta9H","delta9H","delta9H")) ids = as.factor(c("mock_r1","mock_r2","mock_r3","M1_r1","M1_r2","M1_r3","M2_r1","M2_r2","M2_r3","M10_r1","M10_r2","M10_r3","X1457_r1","X1457_r2","X1457_r3","TCR9_r1","TCR9_r2","TCR9_r3","delta9H_r1","delta9H_r2","delta9H_r3")) replicate = as.factor(c("r1","r2","r3","r1","r2","r3","r1","r2","r3","r1","r2","r3","r1","r2","r3","r1","r2","r3","r1","r2","r3")) #Note that we need d cData = data.frame(row.names=colnames(d), condition=condition, replicate=replicate, ids=ids) dds<-DESeqDataSetFromMatrix(countData=d, colData=cData, design=~condition) #batch+ > sizeFactors(dds) NULL > dds <- estimateSizeFactors(dds) > sizeFactors(dds) mock_r1 mock_r2 mock_r3 M1_r1 M1_r2 M1_r3 M2_r1 1.1510294 1.0108629 1.2046637 0.9219507 1.2912217 1.0233951 1.1781932 M2_r2 M2_r3 M10_r1 M10_r2 M10_r3 X1457_r1 X1457_r2 1.0286656 1.1274057 0.8521032 0.9723604 0.7937256 0.8869522 1.0276279 X1457_r3 TCR9_r1 TCR9_r2 TCR9_r3 delta9H_r1 delta9H_r2 delta9H_r3 0.8798504 1.4702299 0.9617160 1.2175588 0.7935592 0.8016998 1.0166897 bamCoverage --bam ./STAR/V_8_2_4_p600_d3_DonorIAligned.sortedByCoord.out.bam -o bigWigs/ctrl_d3_DonorI_norm.bw --binSize 10 --scaleFactor 0.8182619037059573 --effectiveGenomeSize 2913022398 bamCoverage --bam ./STAR/V_8_2_3_p600_d3_DonorIIAligned.sortedByCoord.out.bam -o bigWigs/ctrl_d3_DonorII_norm.bw --binSize 10 --scaleFactor 1.230524791752137 --effectiveGenomeSize 2913022398 bamCoverage --bam ./STAR/V_8_2_4_p600_d8_DonorIAligned.sortedByCoord.out.bam -o bigWigs/ctrl_d8_DonorI_norm.bw --binSize 10 --scaleFactor 0.9406161731990421 --effectiveGenomeSize 2913022398 bamCoverage --bam ./STAR/V_8_2_3_p600_d8_DonorIIAligned.sortedByCoord.out.bam -o bigWigs/ctrl_d8_DonorII_norm.bw --binSize 10 --scaleFactor 1.5944164810367278 --effectiveGenomeSize 2913022398 bamCoverage --bam ./STAR/V_8_4_2_p602_d3_DonorIAligned.sortedByCoord.out.bam -o bigWigs/LT_d3_DonorI_norm.bw --binSize 10 --scaleFactor 1.1691469144166922 --effectiveGenomeSize 2913022398 bamCoverage --bam ./STAR/V_8_4_2_p602_d3_DonorIIAligned.sortedByCoord.out.bam -o bigWigs/LT_d3_DonorII_norm.bw --binSize 10 --scaleFactor 0.9627956504743693 --effectiveGenomeSize 2913022398 bamCoverage --bam ./STAR/V_8_4_2_p602_d8_DonorIAligned.sortedByCoord.out.bam -o bigWigs/LT_d8_DonorI_norm.bw --binSize 10 --scaleFactor 0.9685710322875091 --effectiveGenomeSize 2913022398 bamCoverage --bam ./STAR/V_8_4_1_p602_d8_DonorIIAligned.sortedByCoord.out.bam -o bigWigs/LT_d8_DonorII_norm.bw --binSize 10 --scaleFactor 0.7369838699288324 --effectiveGenomeSize 2913022398 bamCoverage --bam ./STAR/V_8_2_4_p605_d3_DonorIAligned.sortedByCoord.out.bam -o bigWigs/LTtr_d3_DonorI_norm.bw --binSize 10 --scaleFactor 0.7650745897995206 --effectiveGenomeSize 2913022398 bamCoverage --bam ./STAR/V_8_2_3_p605_d3_DonorIIAligned.sortedByCoord.out.bam -o bigWigs/LTtr_d3_DonorII_norm.bw --binSize 10 --scaleFactor 1.2072732417906324 --effectiveGenomeSize 2913022398 bamCoverage --bam ./STAR/V_8_2_4_p605_d8_DonorIAligned.sortedByCoord.out.bam -o bigWigs/LTtr_d8_DonorI_norm.bw --binSize 10 --scaleFactor 0.617050461769713 --effectiveGenomeSize 2913022398 bamCoverage --bam ./STAR/V_8_2_3_p605_d8_DonorIIAligned.sortedByCoord.out.bam -o bigWigs/LTtr_d8_DonorII_norm.bw --binSize 10 --scaleFactor 1.1972841763570858 --effectiveGenomeSize 2913022398 bamCoverage --bam ./STAR/K331A_DonorIAligned.sortedByCoord.out.bam -o bigWigs/K331A_DonorI_norm.bw --binSize 10 --scaleFactor 0.5914211756222816 --effectiveGenomeSize 2913022398 bamCoverage --bam ./STAR/K331A_DonorIIAligned.sortedByCoord.out.bam -o bigWigs/K331A_DonorII_norm.bw --binSize 10 --scaleFactor 1.6631219993121327 --effectiveGenomeSize 2913022398 rld <- rlogTransformation(dds) -
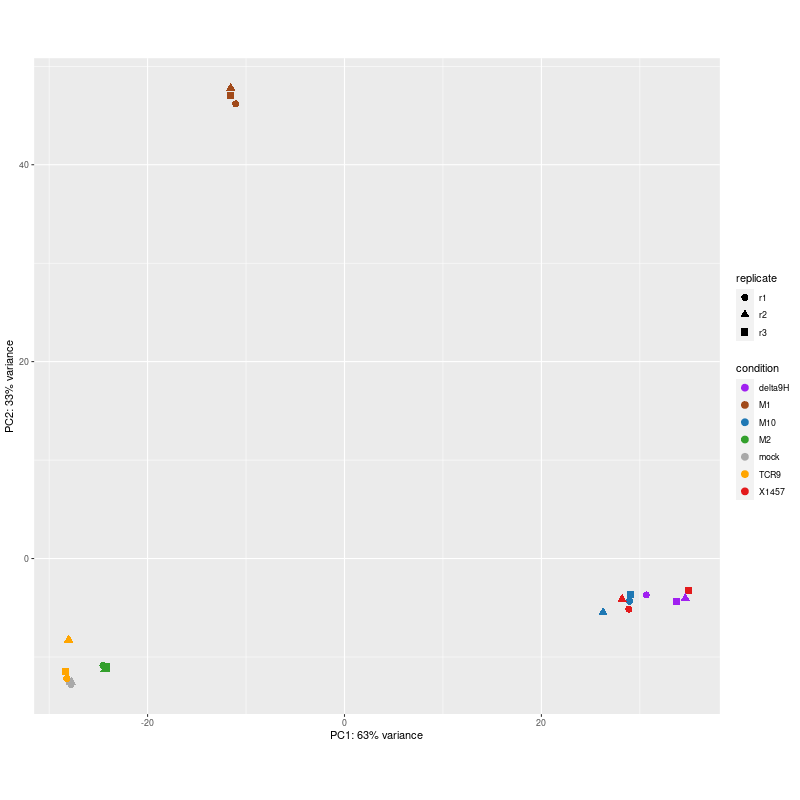
library(ggplot2) svg("pca6.svg") data <- plotPCA(rld, intgroup=c("condition", "replicate"), returnData=TRUE) percentVar <- round(100 * attr(data, "percentVar")) ggplot(data, aes(PC1, PC2, color=condition, shape=replicate)) + geom_point(size=3) + scale_color_manual(values = c("mock" = "grey", "M1"="#1f78b4")) + xlab(paste0("PC1: ",percentVar[1],"% variance")) + ylab(paste0("PC2: ",percentVar[2],"% variance")) + coord_fixed() dev.off() png("pca.png", width=800, height=800) data <- plotPCA(rld, intgroup=c("condition", "replicate"), returnData=TRUE) percentVar <- round(100 * attr(data, "percentVar")) ggplot(data, aes(PC1, PC2, color=condition, shape=replicate)) + geom_point(size=3) + scale_color_manual(values = c("mock" = "darkgrey", "M1"="#a14a1a", "M2"="#33a02c", "M10"="#1f78b4", "X1457"="#e31a1c", "TCR9"="orange", "delta9H"="purple")) + xlab(paste0("PC1: ",percentVar[1],"% variance")) + ylab(paste0("PC2: ",percentVar[2],"% variance")) + coord_fixed() dev.off() png("pca2.png", 1200, 800) plotPCA(rld, intgroup=c("condition")) dev.off() data <- plotPCA(rld, intgroup=c("condition", "donor"), returnData=TRUE) write.csv(data, file="plotPCA_data.csv") #calculate all PCs including PC3 with the following codes library(genefilter) ntop <- 500 rv <- rowVars(assay(rld)) select <- order(rv, decreasing = TRUE)[seq_len(min(ntop, length(rv)))] mat <- t( assay(rld)[select, ] ) pc <- prcomp(mat) pc$x[,1:3] #df_pc <- data.frame(pc$x[,1:3]) df_pc <- data.frame(pc$x) identical(rownames(data), rownames(df_pc)) #-->TRUE ## define the desired order of row names #desired_order <- rownames(data) ## sort the data frame by the desired order of row names #df <- df[match(desired_order, rownames(df_pc)), ] data$PC1 <- NULL data$PC2 <- NULL merged_df <- merge(data, df_pc, by = "row.names") #merged_df <- merged_df[, -1] row.names(merged_df) <- merged_df$Row.names merged_df$Row.names <- NULL # remove the "name" column merged_df$name <- NULL merged_df <- merged_df[, c("PC1","PC2","PC3","PC4","PC5","PC6","PC7","PC8","group","condition","donor")] #results in 26PCs: merged_df <- merged_df[, c("PC1","PC2","PC3","PC4","PC5","PC6","PC7","PC8","group","condition","donor")] write.csv(merged_df, file="merged_df_8PCs.csv") #> summary(pc) #0.5657 0.2195 0.1347 --> 0.57 0.22 0.13 #Importance of components: # PC1 PC2 PC3 PC4 PC5 PC6 PC7 #Standard deviation 19.4051 12.0878 9.4683 4.5569 4.01016 3.00610 2.71918 #Proportion of Variance 0.5657 0.2195 0.1347 0.0312 0.02416 0.01358 0.01111 #Cumulative Proportion 0.5657 0.7853 0.9200 0.9512 0.97531 0.98889 1.00000 -
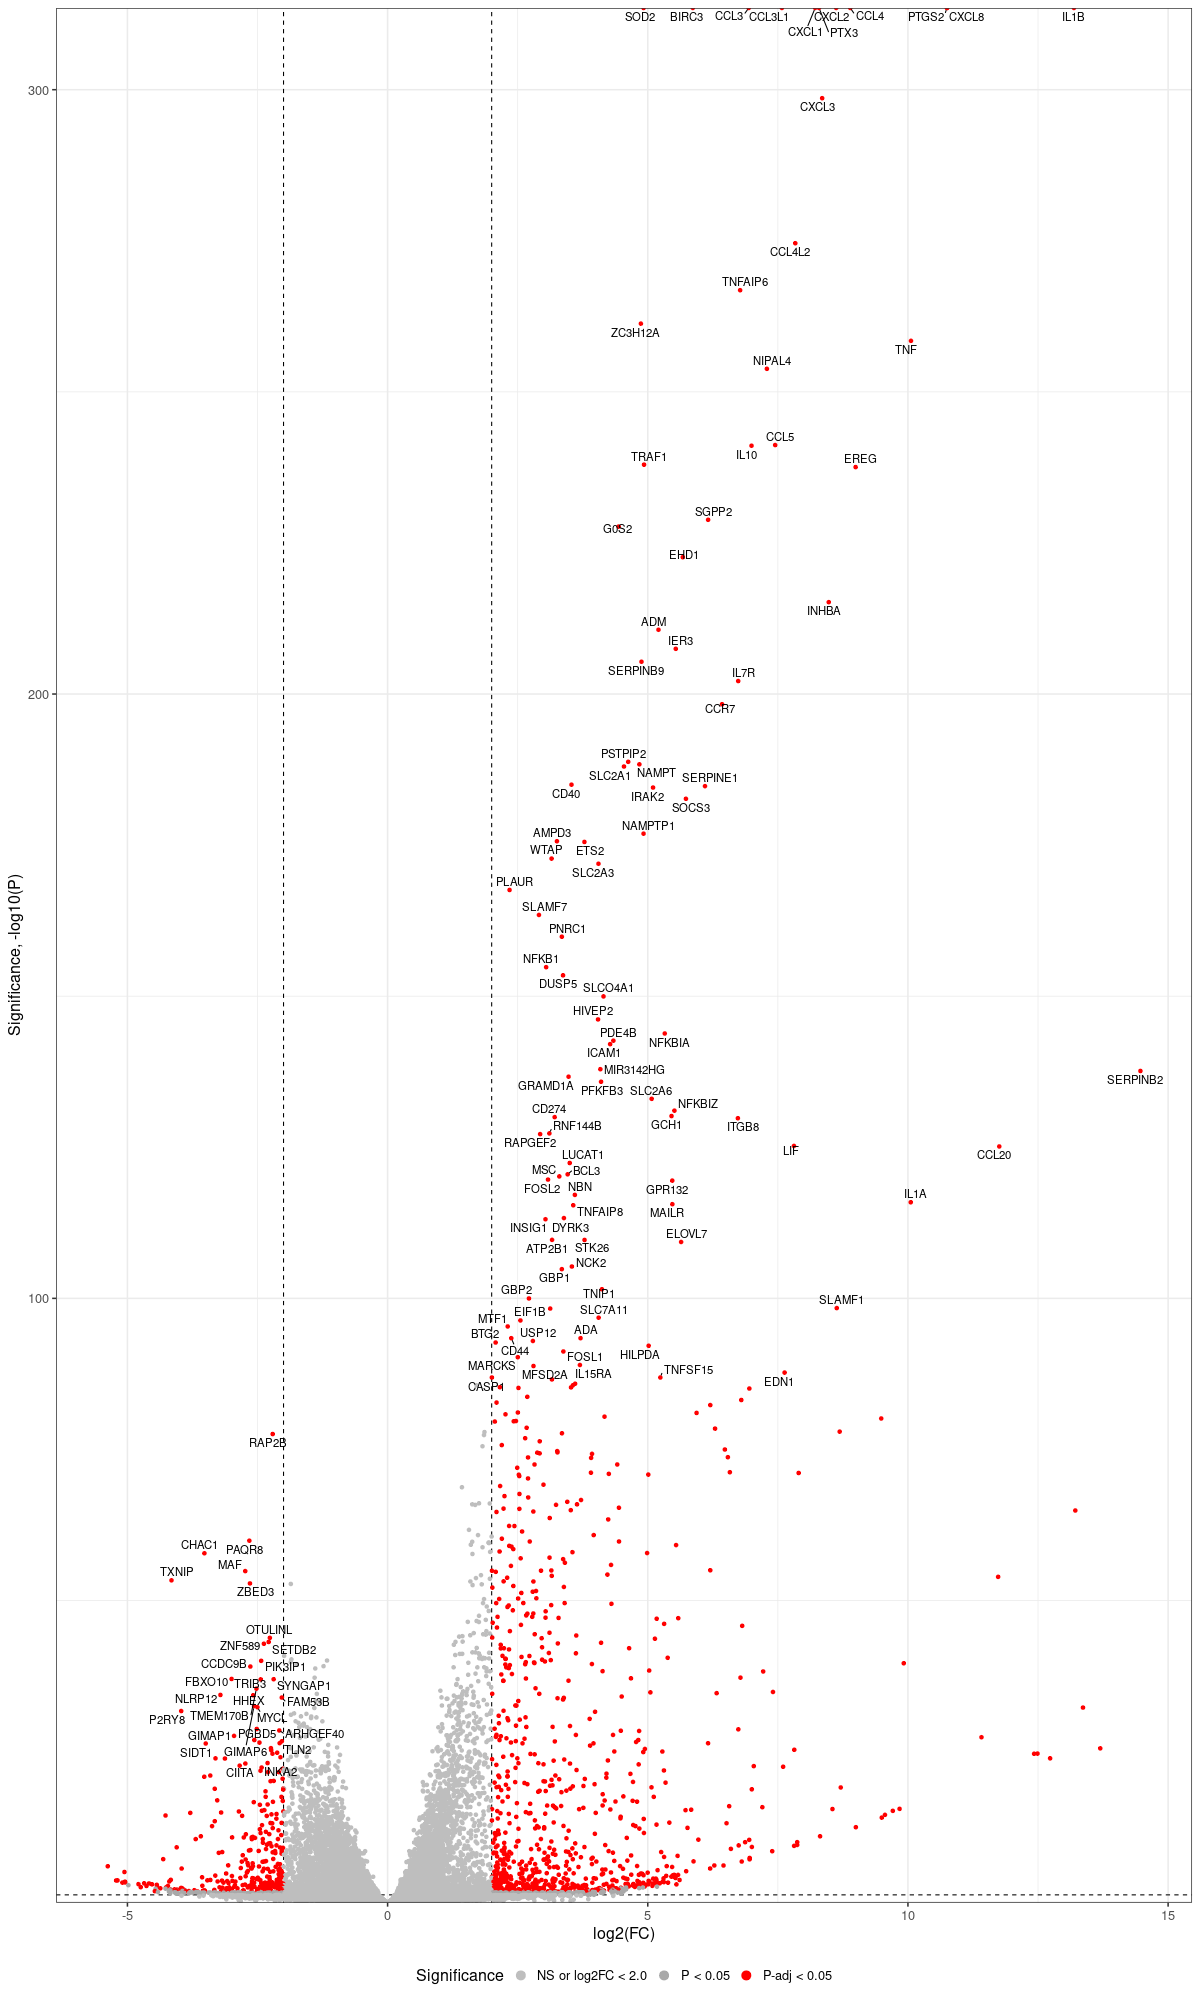
dds$condition <- relevel(dds$condition, "mock") dds = DESeq(dds, betaPrior=FALSE) resultsNames(dds) clist <- c("M1_vs_mock","M2_vs_mock","M10_vs_mock", "delta9H_vs_mock","TCR9_vs_mock","X1457_vs_mock") dds$condition <- relevel(dds$condition, "X1457") dds = DESeq(dds, betaPrior=FALSE) resultsNames(dds) clist <- c("M10_vs_X1457", "delta9H_vs_X1457") library(biomaRt) listEnsembl() listMarts() ensembl <- useEnsembl(biomart = "ensembl", dataset = "hsapiens_gene_ensembl", version="104") datasets <- listDatasets(ensembl) listEnsemblArchives() attributes = listAttributes(ensembl) attributes[1:25,] library(dplyr) library(tidyverse) for (i in clist) { #i<-clist[1] #i<-"M1_vs_mock" contrast = paste("condition", i, sep="_") res = results(dds, name=contrast) res <- res[!is.na(res$log2FoldChange),] #geness <- AnnotationDbi::select(edb86, keys = rownames(res), keytype = "GENEID", columns = c("ENTREZID","EXONID","GENEBIOTYPE","GENEID","GENENAME","PROTEINDOMAINSOURCE","PROTEINID","SEQNAME","SEQSTRAND","SYMBOL","TXBIOTYPE","TXID","TXNAME","UNIPROTID")) #geness <- AnnotationDbi::select(edb86, keys = rownames(res), keytype = "GENEID", columns = c("GENEID", "ENTREZID", "SYMBOL", "GENENAME","GENEBIOTYPE","TXBIOTYPE","SEQSTRAND","UNIPROTID")) # In the ENSEMBL-database, GENEID is ENSEMBL-ID. #geness <- AnnotationDbi::select(edb86, keys = rownames(res), keytype = "GENEID", columns = c("GENEID", "SYMBOL", "GENEBIOTYPE")) # "ENTREZID", "TXID","TXBIOTYPE","TXSEQSTART","TXSEQEND" #geness <- geness[!duplicated(geness$GENEID), ] #using getBM replacing AnnotationDbi::select #filters = 'ensembl_gene_id' means the records should always have a valid ensembl_gene_ids. geness <- getBM(attributes = c('ensembl_gene_id', 'external_gene_name', 'gene_biotype', 'entrezgene_id', 'chromosome_name', 'start_position', 'end_position', 'strand', 'description'), filters = 'ensembl_gene_id', values = rownames(res), mart = ensembl) geness_uniq <- distinct(geness, ensembl_gene_id, .keep_all= TRUE) #merge by column by common colunmn name, in the case "GENEID" res$ENSEMBL = rownames(res) identical(rownames(res), rownames(geness_uniq)) res_df <- as.data.frame(res) geness_res <- merge(geness_uniq, res_df, by.x="ensembl_gene_id", by.y="ENSEMBL") dim(geness_res) rownames(geness_res) <- geness_res$ensembl_gene_id geness_res$ensembl_gene_id <- NULL write.csv(as.data.frame(geness_res[order(geness_res$pvalue),]), file = paste(i, "all.txt", sep="-")) up <- subset(geness_res, padj<=0.05 & log2FoldChange>=2) down <- subset(geness_res, padj<=0.05 & log2FoldChange<=-2) write.csv(as.data.frame(up[order(up$log2FoldChange,decreasing=TRUE),]), file = paste(i, "up.txt", sep="-")) write.csv(as.data.frame(down[order(abs(down$log2FoldChange),decreasing=TRUE),]), file = paste(i, "down.txt", sep="-")) } #for i in "M1_vs_mock" "M2_vs_mock" "M10_vs_mock" "delta9H_vs_mock" "TCR9_vs_mock" "X1457_vs_mock"; do for i in "M10_vs_X1457" "delta9H_vs_X1457"; do # read files to geness_res echo "geness_res <- read.csv(file = paste(\"${i}\", \"all.txt\", sep=\"-\"), row.names=1)" echo "subset(geness_res, external_gene_name %in% top_g & pvalue < 0.05 & (abs(geness_res\$log2FoldChange) >= 2.0))" echo "geness_res\$Color <- \"NS or log2FC < 2.0\"" echo "geness_res\$Color[geness_res\$pvalue < 0.05] <- \"P < 0.05\"" echo "geness_res\$Color[geness_res\$padj < 0.05] <- \"P-adj < 0.05\"" echo "geness_res\$Color[abs(geness_res\$log2FoldChange) < 2.0] <- \"NS or log2FC < 2.0\"" echo "write.csv(geness_res, \"${i}_with_Category.csv\")" # pick top genes for either side of volcano to label # order genes for convenience: echo "geness_res\$invert_P <- (-log10(geness_res\$pvalue)) * sign(geness_res\$log2FoldChange)" echo "top_g <- c()" echo "top_g <- c(top_g, \ geness_res[, 'external_gene_name'][order(geness_res[, 'invert_P'], decreasing = TRUE)[1:100]], \ geness_res[, 'external_gene_name'][order(geness_res[, 'invert_P'], decreasing = FALSE)[1:100]])" echo "top_g <- unique(top_g)" echo "geness_res <- geness_res[, -1*ncol(geness_res)]" # remove invert_P from matrix # Graph results echo "png(\"${i}.png\",width=1200, height=2000)" echo "ggplot(geness_res, \ aes(x = log2FoldChange, y = -log10(pvalue), \ color = Color, label = external_gene_name)) + \ geom_vline(xintercept = c(2.0, -2.0), lty = \"dashed\") + \ geom_hline(yintercept = -log10(0.05), lty = \"dashed\") + \ geom_point() + \ labs(x = \"log2(FC)\", y = \"Significance, -log10(P)\", color = \"Significance\") + \ scale_color_manual(values = c(\"P < 0.05\"=\"darkgray\",\"P-adj < 0.05\"=\"red\",\"lysosomal\"=\"lightblue\",\"TFEB\"=\"green\",\"lysosomal & TFEB\"=\"cyan\",\"NS or log2FC < 2.0\"=\"gray\"),guide = guide_legend(override.aes = list(size = 4))) + scale_y_continuous(expand = expansion(mult = c(0,0.05))) + \ geom_text_repel(data = subset(geness_res, external_gene_name %in% top_g & pvalue < 0.05 & (abs(geness_res\$log2FoldChange) >= 2.0)), size = 4, point.padding = 0.15, color = \"black\", min.segment.length = .1, box.padding = .2, lwd = 2) + \ theme_bw(base_size = 16) + \ theme(legend.position = \"bottom\")" echo "dev.off()" done ~/Tools/csv2xls-0.4/csv_to_xls.py \ M1_vs_mock-all.txt \ M1_vs_mock-up.txt \ M1_vs_mock-down.txt \ -d$',' -o M1_vs_mock.xls; -
clustering the genes and draw heatmap

up1 <-read.csv(file="./M1_vs_mock-up.txt", header = TRUE, row.names = 1)
up2 <-read.csv(file="./M2_vs_mock-up.txt", header = TRUE, row.names = 1)
up3 <-read.csv(file="./M10_vs_mock-up.txt", header = TRUE, row.names = 1)
up4 <-read.csv(file="./delta9H_vs_mock-up.txt", header = TRUE, row.names = 1)
up5 <-read.csv(file="./TCR9_vs_mock-up.txt", header = TRUE, row.names = 1)
up6 <-read.csv(file="./X1457_vs_mock-up.txt", header = TRUE, row.names = 1)

down1 <-read.csv(file="./M1_vs_mock-down.txt", header = TRUE, row.names = 1)
down2 <-read.csv(file="./M2_vs_mock-down.txt", header = TRUE, row.names = 1)
down3 <-read.csv(file="./M10_vs_mock-down.txt", header = TRUE, row.names = 1)
down4 <-read.csv(file="./delta9H_vs_mock-down.txt", header = TRUE, row.names = 1)
down5 <-read.csv(file="./TCR9_vs_mock-down.txt", header = TRUE, row.names = 1)
down6 <-read.csv(file="./X1457_vs_mock-down.txt", header = TRUE, row.names = 1)

RNASeq.NoCellLine <- assay(rld)
#Option3: as paper described, A heatmap showing expression values of all DEGs which are significant between any pair conditions.
all_genes <- c(rownames(up1),rownames(down1),  rownames(up2),rownames(down2), rownames(up3),rownames(down3), rownames(up4),rownames(down4), rownames(up5),rownames(down5), rownames(up6),rownames(down6))  #5473
all_genes <- unique(all_genes)   #2971
RNASeq.NoCellLine_  <- RNASeq.NoCellLine[all_genes,]
write.csv(as.data.frame(RNASeq.NoCellLine_), file ="significant_gene_expressions.txt")

#clustering methods: "ward.D", "ward.D2", "single", "complete", "average" (= UPGMA), "mcquitty" (= WPGMA), "median" (= WPGMC) or "centroid" (= UPGMC).  pearson or spearman
datamat = RNASeq.NoCellLine_
hr <- hclust(as.dist(1-cor(t(datamat), method="pearson")), method="complete")
hc <- hclust(as.dist(1-cor(datamat, method="spearman")), method="complete")
mycl = cutree(hr, h=max(hr$height)/1.08)
mycol = c("YELLOW", "DARKBLUE", "DARKORANGE", "DARKMAGENTA", "DARKCYAN", "DARKRED",  "MAROON", "DARKGREEN", "LIGHTBLUE", "PINK", "MAGENTA", "LIGHTCYAN","LIGHTGREEN", "BLUE", "ORANGE", "CYAN", "RED", "GREEN");

mycol = mycol[as.vector(mycl)]
#sampleCols <- rep('GREY',ncol(RNASeq.NoCellLine_))
#names(sampleCols) <- c("mock_r1", "mock_r2", "mock_r3", "mock_r4", "WAP_r1", "WAP_r2",  "WAP_r3", "WAP_r4", "WAC_r1","WAC_r2")
#sampleCols[substr(colnames(RNASeq.NoCellLine_),1,4)=='mock'] <- 'GREY'
#sampleCols[substr(colnames(RNASeq.NoCellLine_),1,3)=='WAP'] <- 'RED'
#sampleCols[substr(colnames(RNASeq.NoCellLine_),1,3)=='dM_'] <- 'CYAN'
#sampleCols[substr(colnames(RNASeq.NoCellLine_),1,3)=='dP_'] <- 'BLUE'
#sampleCols[substr(colnames(RNASeq.NoCellLine_),1,3)=='WAC'] <- 'GREEN'
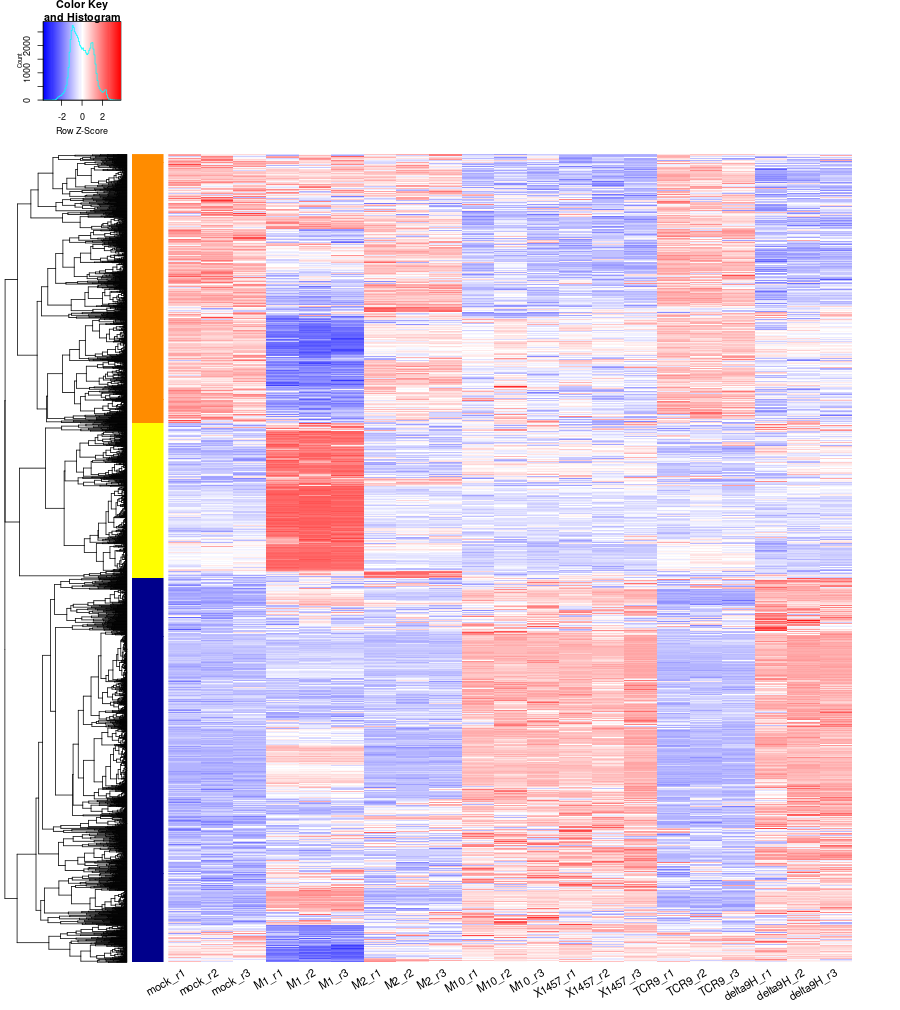
png("DEGs_heatmap.png", width=900, height=1010)
heatmap.2(as.matrix(datamat),Rowv=as.dendrogram(hr),Colv = NA, dendrogram = 'row',
            scale='row',trace='none',col=bluered(75),
            RowSideColors = mycol, labRow="", srtCol=30, keysize=0.72, cexRow = 2, cexCol = 1.4)
dev.off()

#### cluster members #####
write.csv(names(subset(mycl, mycl == '1')),file='cluster1_YELLOW.txt')
write.csv(names(subset(mycl, mycl == '2')),file='cluster2_DARKBLUE.txt')
write.csv(names(subset(mycl, mycl == '3')),file='cluster3_DARKORANGE.txt')

~/Tools/csv2xls-0.4/csv_to_xls.py \
cluster1_YELLOW.txt \
cluster2_DARKBLUE.txt \
cluster3_DARKORANGE.txt \
-d$',' -o gene_culsters.xls;

~/Tools/csv2xls-0.4/csv_to_xls.py \
significant_gene_expressions.txt \
-d',' -o DEGs_heatmap_data.xls;
点赞本文的读者
还没有人对此文章表态
本文有评论
没有评论
看文章,发评论,不要沉默
最受欢迎文章
- Motif Discovery in Biological Sequences: A Comparison of MEME and HOMER
- Calling peaks using findPeaks of HOMER
- Kraken2 Installation and Usage Guide
- Why Do Significant Gene Lists Change After Adding Additional Conditions in Differential Gene Expression Analysis?
- Should the inputs for GSVA be normalized or raw?
- PiCRUST2 Pipeline for Functional Prediction and Pathway Analysis in Metagenomics
- Updating Human Gene Identifiers using Ensembl BioMart: A Step-by-Step Guide
- pheatmap vs heatmap.2
- Setup conda environments
- Guide to Submitting Data to GEO (Gene Expression Omnibus)
最新文章
- Risks of Rebooting into Rescue Mode
- 足突(Podosome)、胞外囊泡(Extracellular Vesicle)与基质金属蛋白酶(MMPs)综合解析
- NCBI BioSample Submission Strategy for PJI and Nasal Microbiota Study
- Human RNA-seq processing for Data_Ben_RNAseq_2025
最多评论文章
- Updating Human Gene Identifiers using Ensembl BioMart: A Step-by-Step Guide
- The top 10 genes
- Retrieving KEGG Genes Using Bioservices in Python
推荐相似文章
Processing RNAseq_2025_WT_vs_ΔIJ_on_ATCC19606
How to correlate RNA-seq Data with Mass Spectrometry Proteomics Data?
Processing Data_Tam_RNAseq_2025_LB_vs_Mac_ATCC19606
RNA-seq Tam on Acinetobacter baumannii strain ATCC 19606 CP059040.1 (Data_Tam_RNAseq_2024)

