Density of motif plots and its statistical tests
gene_x 0 like s 1832 view s
Tags: plot, python, R, Biopython, ChIP-seq
-
plot peaks
@Input: the peak bed-files @Output: peak_tss_distances_NHDF_.xlsx peak_tss_distances_NHDF_.txt peak_distribution_NHDF_.csv peak_distribution_NHDF_.png @RUN: python3 plot_peaks.py peaks_NHDF_.bed /home/jhuang/REFs/gencode.v43.annotation.gtf.db /ref/Homo_sapiens/UCSC/hg38/Sequence/WholeGenomeFasta/genome.fa @RUN: python3 plot_peaks.py peaks_HEK293_.bed /home/jhuang/REFs/gencode.v43.annotation.gtf.db /ref/Homo_sapiens/UCSC/hg38/Sequence/WholeGenomeFasta/genome.fa @RUN: python3 plot_peaks.py peaks_PFSK-1_.bed /home/jhuang/REFs/gencode.v43.annotation.gtf.db /ref/Homo_sapiens/UCSC/hg38/Sequence/WholeGenomeFasta/genome.fa @RUN: python3 plot_peaks.py peaks_K331A_.bed /home/jhuang/REFs/gencode.v43.annotation.gtf.db /ref/Homo_sapiens/UCSC/hg38/Sequence/WholeGenomeFasta/genome.fa -
filtering the cloeset genes when the absolute values of Distance to TSS is smaller than or equal to 3000 using python.
@Input: peak_tss_distances_NHDF_.txt @RUN: python3 filter_genes_with_peaks.py peak_tss_distances_NHDF_.txt import pandas as pd import argparse def filter_and_save_genes(input_file): # Read the dataframe df = pd.read_csv(input_file, sep='\t') # Convert Distance to TSS to absolute values df['Distance to TSS'] = df['Distance to TSS'].abs() # Filter dataframe where Distance to TSS <= 3000 filtered_df = df[df['Distance to TSS'] <= 3000] # Get the list of gene names gene_names = filtered_df['Closest Gene (Gene name)'].tolist() # Join the gene names with a comma gene_names_string = ','.join(gene_names) # Print the gene names print(gene_names_string) # Save the gene names to a text file #with open('gene_names.txt', 'w') as file: # file.write(gene_names_string) # Convert the list of gene names to a DataFrame gene_names_df = pd.DataFrame(gene_names, columns=['Gene Name']) # Save the DataFrame to an Excel file gene_names_df.to_excel('gene_with_peaks_in_promoter_NHDF.xlsx', index=False) if __name__ == '__main__': parser = argparse.ArgumentParser(description='Process some integers.') parser.add_argument('input_file', help='The path to the input file') args = parser.parse_args() filter_and_save_genes(args.input_file) -
draw venn diagrams based on the gene names
import pandas as pd import matplotlib.pyplot as plt from matplotlib_venn import venn2, venn3 # Read the gene names from the Excel files df1 = pd.read_excel('gene_with_peaks_in_promoter_NHDF.xlsx') # generated in the STEP 2 df2 = pd.read_excel('gene_with_peaks_in_promoter_K331A.xlsx') #df2 = pd.read_excel('gene_with_peaks_in_promoter_HEK293.xlsx') df3 = pd.read_excel('gene_with_peaks_in_promoter_PFSK-1.xlsx') # Create sets from the gene names set1 = set(df1['Gene Name']) set2 = set(df2['Gene Name']) set3 = set(df3['Gene Name']) venn2([set1, set2], set_labels=('NHDF LT', 'NHDF LT K331A')) #, set_colors=('skyblue', 'lightgreen') #venn3([set1, set2, set3], set_labels=('NHDF LT', 'HEK293 LT+sT', 'PFSK-1 LT+sT')) plt.title('Genes with Peaks in Promoter', fontsize=16) plt.xticks(fontsize=12) plt.yticks(fontsize=12) plt.savefig('Venn_Diagram_of_Genes_with_Peaks_in_Promoter_NHDF_vs_K331A.png', dpi=300, bbox_inches='tight') # Save the Venn diagram as an image file plt.show() # Display the Venn diagram -
extract the promoter seqeuences, generating promoter_sequences_3000_3000.fasta
#!/usr/bin/env python3 # ./1_generate_promoter_sequences.py /home/jhuang/REFs/gencode.v43.annotation.gtf.db #improve the code to exact alsogene_type except for ensemble_ids and gene_symbol, and save them in the heads. # # Create the database from the GTF file # gtf_file = 'gencode.v43.annotation.gtf' # db_file = 'gencode.v43.annotation.gtf.db' # db = gffutils.create_db(gtf_file, dbfn=db_file, force=True, merge_strategy='merge', verbose=True) import gffutils from pyfaidx import Fasta import argparse from Bio import SeqIO from Bio.SeqRecord import SeqRecord from Bio.Seq import Seq def extract_promoter_sequences(gencode_db, genome_records, upstream_length=3000, downstream_length=3000): db = gffutils.FeatureDB(gencode_db, keep_order=True) promoters = [] for gene in db.features_of_type('gene'): #CDS gene_type = gene.attributes.get('gene_type', [''])[0] #if gene_type == 'protein_coding': if True: if gene.strand == '+': promoter_start = max(gene.start - upstream_length, 1) promoter_end = gene.start + downstream_length - 1 else: # gene.strand == '-' promoter_start = gene.end - downstream_length + 1 promoter_end = min(gene.end + upstream_length, len(genome_records[gene.chrom])) promoter_seq = str(genome_records[gene.chrom][promoter_start-1:promoter_end]) if gene.strand == '-': promoter_seq = str(Seq(promoter_seq).reverse_complement()) gene_symbol = gene.attributes.get('gene_name', [''])[0] gene_type = gene.attributes.get('gene_type', [''])[0] #20042 in which gene_type == 'protein_coding', while 62703 all types. header = f"{gene.id} | Symbol: {gene_symbol} | Type: {gene_type}" #header = f"{gene_symbol}" #record = SeqRecord(Seq(promoter_seq.upper()), id=gene.id, description=gene_symbol) record = SeqRecord(Seq(promoter_seq.upper()), id=gene.id, description=header) promoters.append(record) return promoters if __name__ == "__main__": parser = argparse.ArgumentParser(description='Plot peak distribution around TSS.') parser.add_argument('gencode_db', type=str, help='Path to the gencode.v43.annotation.gtf.db file') args = parser.parse_args() genome_records = Fasta('/ref/Homo_sapiens/UCSC/hg38/Sequence/WholeGenomeFasta/genome.fa') promoter_sequences = extract_promoter_sequences(args.gencode_db, genome_records) SeqIO.write(promoter_sequences, "promoter_sequences_3000_3000.fasta", "fasta") -
find motifs in promoters, generating the file
#!/usr/bin/env python3 #./2_find_motifs_in_promoters.py import re from Bio import SeqIO def find_motif_frequency_and_distribution(fasta_file, output_file, motif_1="GRGGC", motif_2="GCCYC"): motif_1 = motif_1.replace("R", "[AG]").replace("Y", "[CT]") motif_2 = motif_2.replace("R", "[AG]").replace("Y", "[CT]") promoter_sequences = SeqIO.parse(fasta_file, "fasta") with open(output_file, 'w') as f: f.write("PromoterID\tGene_Symbol\tGene_Type\tMotif_GRGGC_Count\tMotif_GCCYC_Count\tMotif_GRGGC_Center_Positions\tMotif_GCCYC_Center_Positions\n") for promoter in promoter_sequences: header_parts = promoter.description.split("|") promoter_id = header_parts[0].strip() gene_symbol = header_parts[1].strip() gene_type = header_parts[2].strip() motif1_positions = [(m.start() + len(motif_1) // 2 - 3000) for m in re.finditer(motif_1, str(promoter.seq))] motif2_positions = [(m.start() + len(motif_2) // 2 - 3000) for m in re.finditer(motif_2, str(promoter.seq))] line = f"{promoter_id}\t{gene_symbol}\t{gene_type}\t{len(motif1_positions)}\t{len(motif2_positions)}\t{motif1_positions}\t{motif2_positions}\n" f.write(line) if __name__ == "__main__": fasta_file = "promoter_sequences_3000_3000.fasta" output_file = "motif_counts_positions.txt" find_motif_frequency_and_distribution(fasta_file, output_file) -
prepare three files from motif_counts_positions.txt and gene_with_peaks_in_promoter_NHDF.xlsx.
library(readxl) #sed -i 's/[][]//g' motif_counts_positions.txt # generated in STEP 5 motif_counts_positions <- read.table("motif_counts_positions.txt", sep="\t", header=TRUE, stringsAsFactors=FALSE) # Read the gene names from the Excel files df1 <- read_excel("gene_with_peaks_in_promoter_NHDF.xlsx") # generated in STEP 2 df2 <- read_excel("gene_with_peaks_in_promoter_K331A.xlsx") # Create a new data frame for rows in 'data' where the PromoterID is in NHDF_LT's Closest Gene --> total 1706 genes gene_and_its_motifs_with_NHDF_LT_peak <- motif_counts_positions[motif_counts_positions$PromoterID %in% unique(df1$`Gene Name`), ] gene_and_its_motifs_with_NHDF_LT_peak$Motif_GRGGC_Center_Positions <- sapply(gene_and_its_motifs_with_NHDF_LT_peak$Motif_GRGGC_Center_Positions, toString) gene_and_its_motifs_with_NHDF_LT_peak$Motif_GCCYC_Center_Positions <- sapply(gene_and_its_motifs_with_NHDF_LT_peak$Motif_GCCYC_Center_Positions, toString) write.table(gene_and_its_motifs_with_NHDF_LT_peak, file="motifs_on_NHDF_LT_promoters.txt", sep="\t", row.names = FALSE) #sed -i 's/Symbol: //g' motifs_on_NHDF_LT_promoters.txt #sed -i 's/Type: //g' motifs_on_NHDF_LT_promoters.txt #sed -i 's/"//g' motifs_on_NHDF_LT_promoters.txt data1 <- read.table("motifs_on_NHDF_LT_promoters.txt", sep="\t", header=TRUE, stringsAsFactors=FALSE) data1$Motif_GRGGC_Count <- as.numeric(data1$Motif_GRGGC_Count) data1$Motif_GCCYC_Count <- as.numeric(data1$Motif_GCCYC_Count) data1$Motif_GRGGC_Center_Positions <- strsplit(as.character(data1$Motif_GRGGC_Center_Positions), ",") data1$Motif_GCCYC_Center_Positions <- strsplit(as.character(data1$Motif_GCCYC_Center_Positions), ",") # Create data1 frames for each motif data1_motif1 <- data.frame(PromoterID = rep(data1$PromoterID, data1$Motif_GRGGC_Count), Motif = "Motif GRGGC", Position = unlist(data1$Motif_GRGGC_Center_Positions)) data1_motif2 <- data.frame(PromoterID = rep(data1$PromoterID, data1$Motif_GCCYC_Count), Motif = "Motif GCCYC", Position = unlist(data1$Motif_GCCYC_Center_Positions)) data1_positions <- rbind(data1_motif1, data1_motif2) # Get positions as numeric values, excluding NAs data1_motif1_positions <- as.numeric(data1_positions$Position[data1_positions$Motif == "Motif GRGGC"]) data1_motif2_positions <- as.numeric(data1_positions$Position[data1_positions$Motif == "Motif GCCYC"]) # Create another data frame for the remaining rows --> total 60997 genes gene_and_its_motifs_without_NHDF_LT_peak <- motif_counts_positions[!motif_counts_positions$PromoterID %in% unique(df1$`Gene Name`), ] gene_and_its_motifs_without_NHDF_LT_peak$Motif_GRGGC_Center_Positions <- sapply(gene_and_its_motifs_without_NHDF_LT_peak$Motif_GRGGC_Center_Positions, toString) gene_and_its_motifs_without_NHDF_LT_peak$Motif_GCCYC_Center_Positions <- sapply(gene_and_its_motifs_without_NHDF_LT_peak$Motif_GCCYC_Center_Positions, toString) write.table(gene_and_its_motifs_without_NHDF_LT_peak, file="motifs_on_NOT_NHDF_LT_promoters.txt", sep="\t", row.names = FALSE) #sed -i 's/Symbol: //g' motifs_on_NOT_NHDF_LT_promoters.txt #sed -i 's/Type: //g' motifs_on_NOT_NHDF_LT_promoters.txt #sed -i 's/"//g' motifs_on_NOT_NHDF_LT_promoters.txt data2 <- read.table("motifs_on_NOT_NHDF_LT_promoters.txt", sep="\t", header=TRUE, stringsAsFactors=FALSE) data2$Motif_GRGGC_Count <- as.numeric(data2$Motif_GRGGC_Count) data2$Motif_GCCYC_Count <- as.numeric(data2$Motif_GCCYC_Count) data2$Motif_GRGGC_Center_Positions <- strsplit(as.character(data2$Motif_GRGGC_Center_Positions), ",") data2$Motif_GCCYC_Center_Positions <- strsplit(as.character(data2$Motif_GCCYC_Center_Positions), ",") # Create data2 frames for each motif data2_motif1 <- data.frame(PromoterID = rep(data2$PromoterID, data2$Motif_GRGGC_Count), Motif = "Motif GRGGC", Position = unlist(data2$Motif_GRGGC_Center_Positions)) data2_motif2 <- data.frame(PromoterID = rep(data2$PromoterID, data2$Motif_GCCYC_Count), Motif = "Motif GCCYC", Position = unlist(data2$Motif_GCCYC_Center_Positions)) data2_positions <- rbind(data2_motif1, data2_motif2) # Get positions as numeric values, excluding NAs data2_motif1_positions <- as.numeric(data2_positions$Position[data2_positions$Motif == "Motif GRGGC"]) data2_motif2_positions <- as.numeric(data2_positions$Position[data2_positions$Motif == "Motif GCCYC"]) # Create a new data frame for rows in 'data' where the PromoterID is in NHDF_LT_K331A's Closest Gene --> total 310 genes gene_and_its_motifs_with_NHDF_LT_K331A_peak <- motif_counts_positions[motif_counts_positions$PromoterID %in% unique(df2$`Gene Name`), ] gene_and_its_motifs_with_NHDF_LT_K331A_peak$Motif_GRGGC_Center_Positions <- sapply(gene_and_its_motifs_with_NHDF_LT_K331A_peak$Motif_GRGGC_Center_Positions, toString) gene_and_its_motifs_with_NHDF_LT_K331A_peak$Motif_GCCYC_Center_Positions <- sapply(gene_and_its_motifs_with_NHDF_LT_K331A_peak$Motif_GCCYC_Center_Positions, toString) write.table(gene_and_its_motifs_with_NHDF_LT_K331A_peak, file="motifs_on_NHDF_LT_K331A_promoters.txt", sep="\t", row.names = FALSE) #sed -i 's/Symbol: //g' motifs_on_NHDF_LT_K331A_promoters.txt #sed -i 's/Type: //g' motifs_on_NHDF_LT_K331A_promoters.txt #sed -i 's/"//g' motifs_on_NHDF_LT_K331A_promoters.txt data3 <- read.table("motifs_on_NHDF_LT_K331A_promoters.txt", sep="\t", header=TRUE, stringsAsFactors=FALSE) data3$Motif_GRGGC_Count <- as.numeric(data3$Motif_GRGGC_Count) data3$Motif_GCCYC_Count <- as.numeric(data3$Motif_GCCYC_Count) data3$Motif_GRGGC_Center_Positions <- strsplit(as.character(data3$Motif_GRGGC_Center_Positions), ",") data3$Motif_GCCYC_Center_Positions <- strsplit(as.character(data3$Motif_GCCYC_Center_Positions), ",") # Create data3 frames for each motif data3_motif1 <- data.frame(PromoterID = rep(data3$PromoterID, data3$Motif_GRGGC_Count), Motif = "Motif GRGGC", Position = unlist(data3$Motif_GRGGC_Center_Positions)) data3_motif2 <- data.frame(PromoterID = rep(data3$PromoterID, data3$Motif_GCCYC_Count), Motif = "Motif GCCYC", Position = unlist(data3$Motif_GCCYC_Center_Positions)) data3_positions <- rbind(data3_motif1, data3_motif2) # Get positions as numeric values, excluding NAs data3_motif1_positions <- as.numeric(data3_positions$Position[data3_positions$Motif == "Motif GRGGC"]) data3_motif2_positions <- as.numeric(data3_positions$Position[data3_positions$Motif == "Motif GCCYC"]) -
Plot Histogram of counts and density of positions
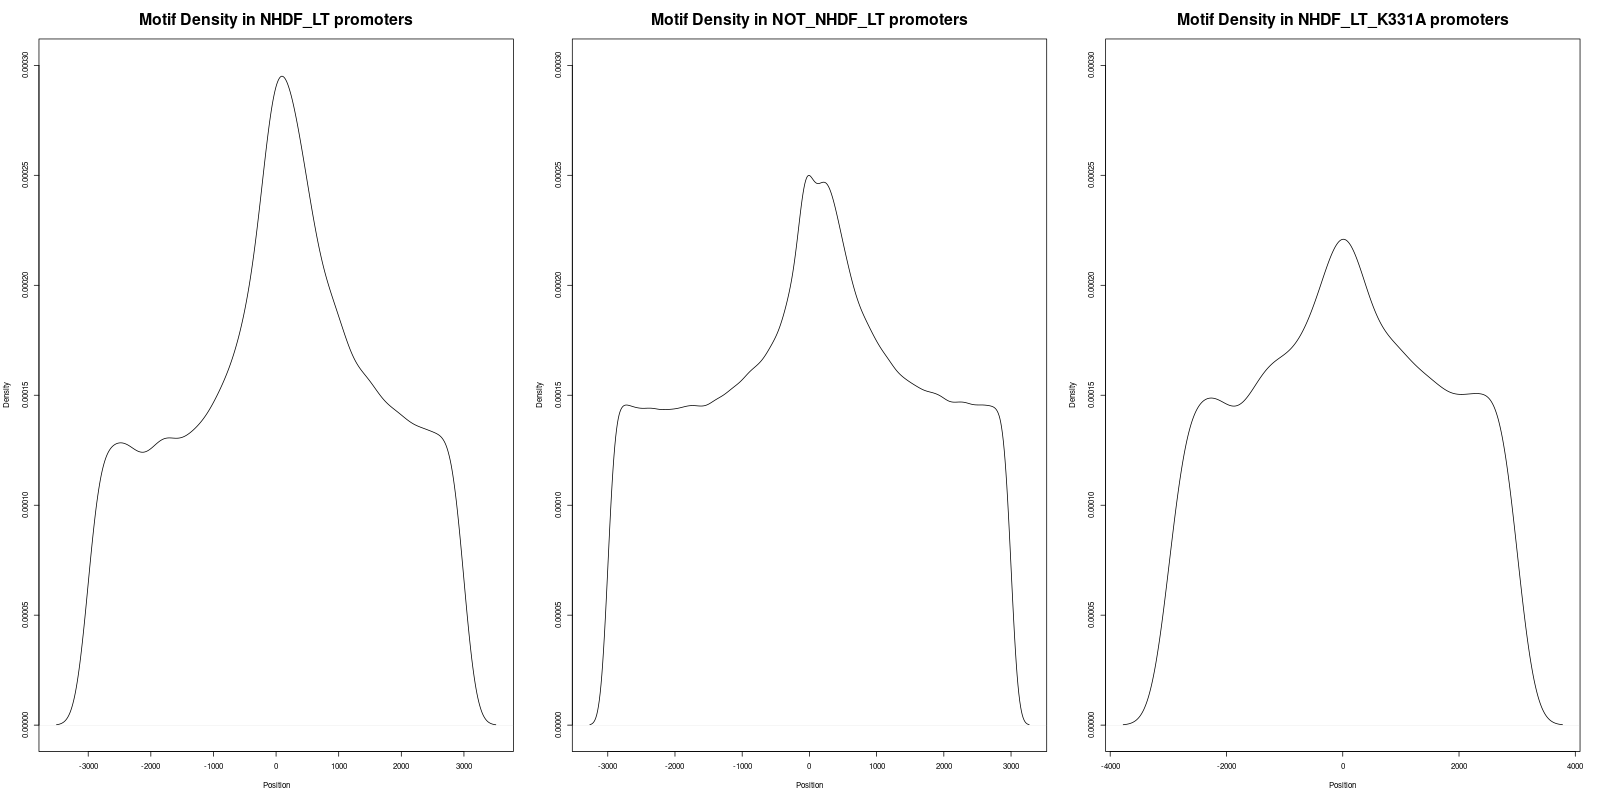
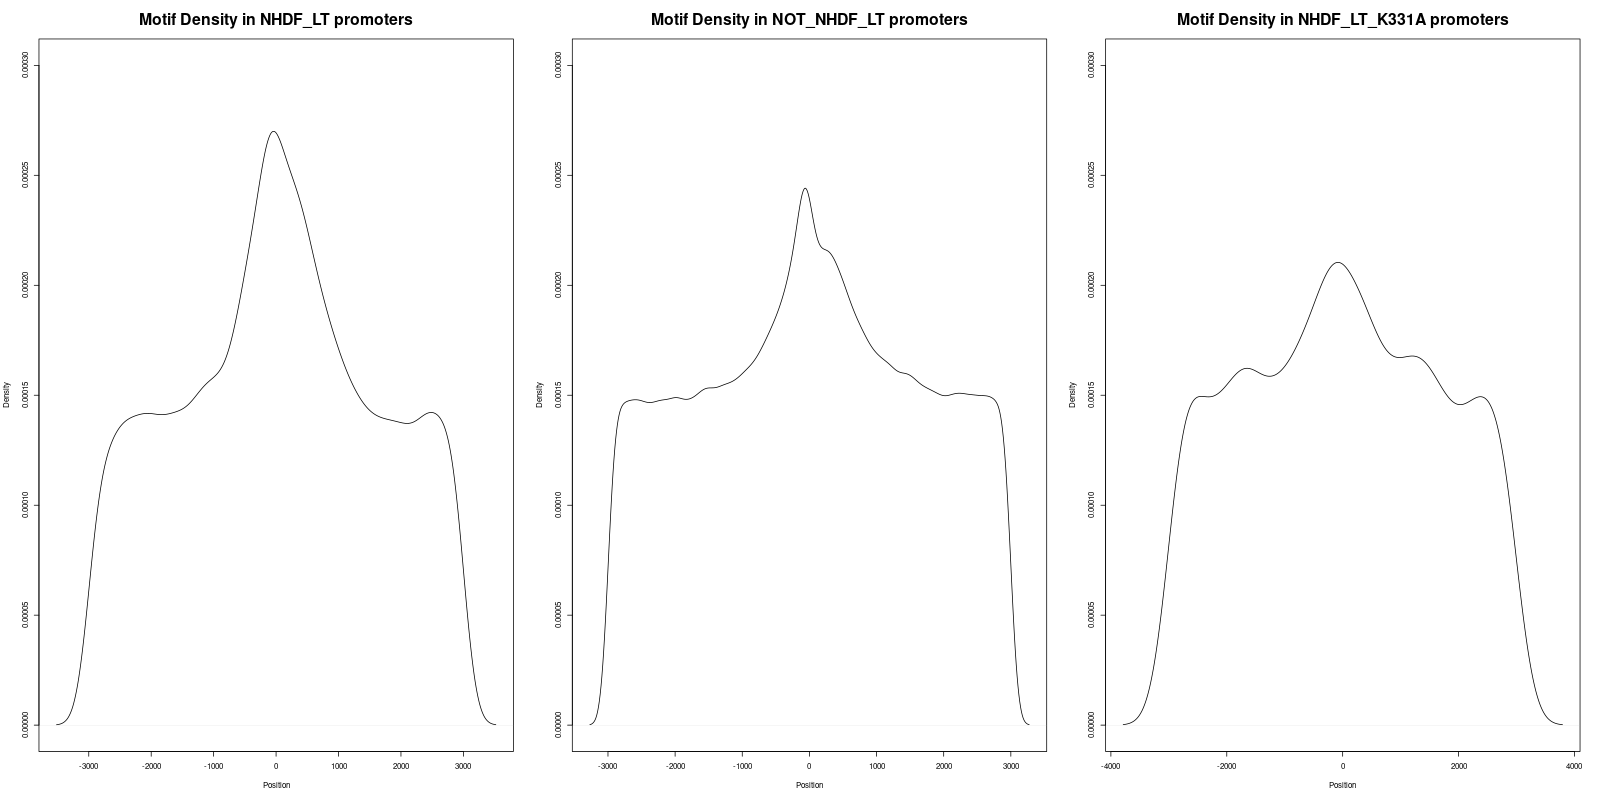
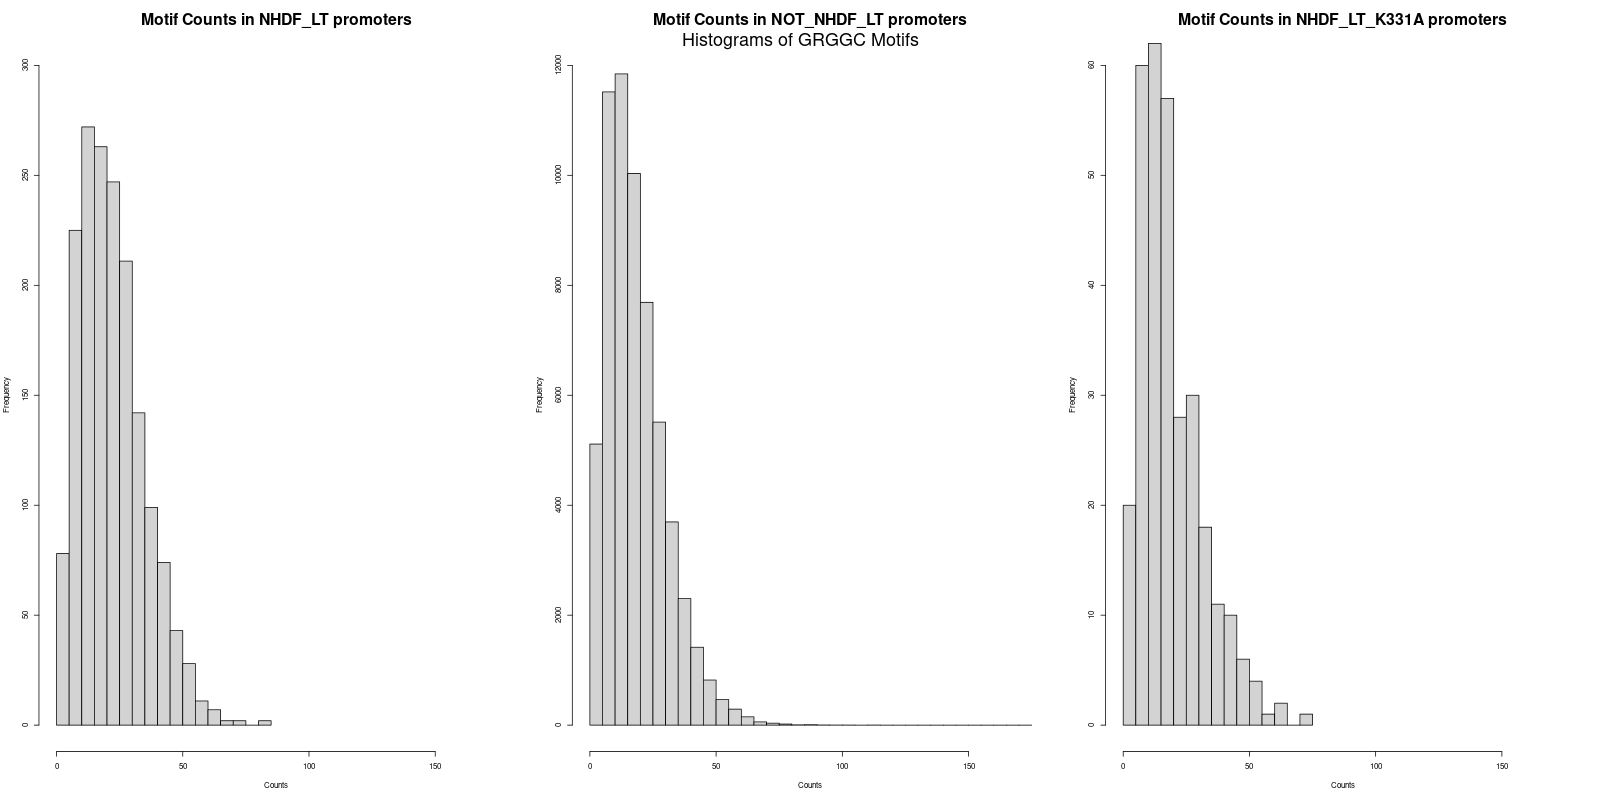
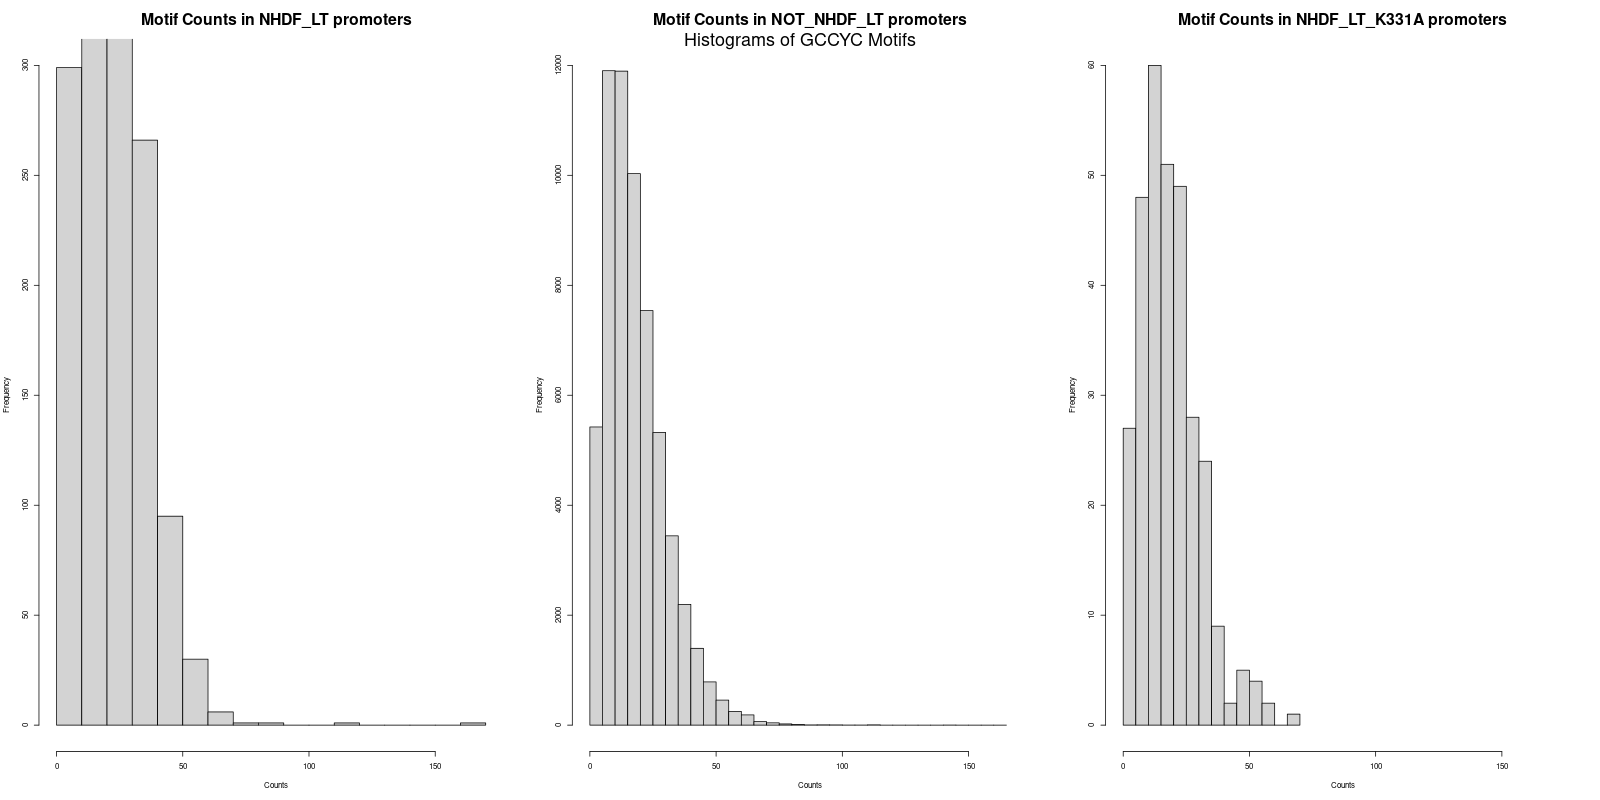
# Adjust the number of breaks (nbins) to control the width of histograms x_limit <- max(max(data1$Motif_GRGGC_Count), max(data1$Motif_GCCYC_Count), max(data2$Motif_GRGGC_Count), max(data2$Motif_GCCYC_Count), max(data3$Motif_GRGGC_Count), max(data3$Motif_GCCYC_Count)) y_limit1 <- 300 y_limit2 <- 12000 y_limit3 <- 60 # Set up the layout for the plots png("Histogram_of_GRGGC_Motifs.png", width = 1600, height = 800) par(mfrow = c(1, 3)) hist(data1$Motif_GRGGC_Count, main = "Motif Counts in NHDF_LT promoters", xlab = "Counts", xlim = c(0, x_limit), ylim = c(0, y_limit1), breaks = 20, cex.main = 2) hist(data2$Motif_GRGGC_Count, main = "Motif Counts in NOT_NHDF_LT promoters", xlab = "Counts", xlim = c(0, x_limit), ylim = c(0, y_limit2), breaks = 30, cex.main = 2) hist(data3$Motif_GRGGC_Count, main = "Motif Counts in NHDF_LT_K331A promoters", xlab = "Counts", xlim = c(0, x_limit), ylim = c(0, y_limit3), breaks = 10, cex.main = 2) mtext("Histograms of GRGGC Motifs", outer = TRUE, line = -5, cex = 1.5) dev.off() png("Histogram_of_GCCYC_Motifs.png", width = 1600, height = 800) par(mfrow = c(1, 3)) hist(data1$Motif_GCCYC_Count, main = "Motif Counts in NHDF_LT promoters", xlab = "Counts", xlim = c(0, x_limit), ylim = c(0, y_limit1), breaks = 20, cex.main = 2) hist(data2$Motif_GCCYC_Count, main = "Motif Counts in NOT_NHDF_LT promoters", xlab = "Counts", xlim = c(0, x_limit), ylim = c(0, y_limit2), breaks = 30, cex.main = 2) hist(data3$Motif_GCCYC_Count, main = "Motif Counts in NHDF_LT_K331A promoters", xlab = "Counts", xlim = c(0, x_limit), ylim = c(0, y_limit3), breaks = 10, cex.main = 2) mtext("Histograms of GCCYC Motifs", outer = TRUE, line = -5, cex = 1.5) dev.off() # Set the ylim value ylim <- c(0.0000, 0.0003) png("Density_of_GRGGC_Motifs.png", width = 1600, height = 800) par(mfrow = c(1, 3)) plot(density(data1_motif1_positions, na.rm = TRUE), main = "Motif Density in NHDF_LT promoters", xlab = "Position", ylim = ylim, cex.main = 2) plot(density(data2_motif1_positions, na.rm = TRUE), main = "Motif Density in NOT_NHDF_LT promoters", xlab = "Position", ylim = ylim, cex.main = 2) plot(density(data3_motif1_positions, na.rm = TRUE), main = "Motif Density in NHDF_LT_K331A promoters", xlab = "Position", ylim = ylim, cex.main = 2) #mtext("Density of GRGGC Motifs", outer = TRUE, line = -5, cex = 1.5) dev.off() png("Density_of_GCCYC_Motifs.png", width = 1600, height = 800) par(mfrow = c(1, 3)) plot(density(data1_motif2_positions, na.rm = TRUE), main = "Motif Density in NHDF_LT promoters", xlab = "Position", ylim = ylim, cex.main = 2) plot(density(data2_motif2_positions, na.rm = TRUE), main = "Motif Density in NOT_NHDF_LT promoters", xlab = "Position", ylim = ylim, cex.main = 2) plot(density(data3_motif2_positions, na.rm = TRUE), main = "Motif Density in NHDF_LT_K331A promoters", xlab = "Position", ylim = ylim, cex.main = 2) #mtext("Density of GCCYC Motifs", outer = TRUE, line = -5, cex = 1.5) dev.off() -
Statistical tests
How to perform a statistical test from density plots? There is in the center positions a much higher possibility than background? This means, in a condition, the peaks occurs more often in the central positions? How to perform a statistical test to see if they are significant?
If you are interested in testing whether the density of peaks in the central positions is significantly different from the background, a suitable statistical test might be a permutation test, or perhaps a Kolmogorov-Smirnov (KS) test. The KS test, in particular, is a non-parametric test that compares two continuous one-dimensional probability distributions.
Here is an example of how you might do this using the KS test in R:
# Suppose `data1_motif1_positions` and `data2_motif2_positions` are your two datasets
ks.test(data1_motif1_positions, data2_motif1_positions)
#D = 0.034868, p-value < 2.2e-16
ks.test(data1_motif1_positions, data3_motif1_positions)
#D = 0.048238, p-value = 4.959e-11
ks.test(data2_motif1_positions, data3_motif1_positions)
#D = 0.016348, p-value = 0.07909
ks.test(data1_motif2_positions, data2_motif2_positions)
#D = 0.022212, p-value = 4.441e-16
ks.test(data1_motif2_positions, data3_motif2_positions)
#D = 0.038822, p-value = 4.049e-07
ks.test(data2_motif2_positions, data3_motif2_positions)
#D = 0.018951, p-value = 0.02927

pvalues <- c(2.2e-16, 4.959e-11, 0.07909)
bonferroni <- p.adjust(pvalues, method = "bonferroni") #"bonferroni", "BH", "holm"
print(bonferroni)
#6.6000e-16 1.4877e-10 2.3727e-01
pvalues <- c(4.441e-16, 4.049e-07, 0.02927)
bonferroni <- p.adjust(pvalues, method = "bonferroni")
print(bonferroni)
#1.3323e-15 1.2147e-06 8.7810e-02
The ks.test function will return a test statistic and a p-value. The null hypothesis of the KS test is that the two samples are drawn from the same distribution. Therefore, a small p-value (typically, p < 0.05) would lead you to reject the null hypothesis and conclude that there is a significant difference between the two distributions.
Note that the KS test, like all statistical tests, has assumptions and limitations. It is sensitive to differences in both location and shape of the empirical cumulative distribution functions of the two samples. It also assumes that the samples are independent and identically distributed, which may or may not be appropriate depending on your specific data and research question. Therefore, the test results should be interpreted in the context of these assumptions.
Keep in mind that while this test can indicate whether the densities are different, it does not specify where these differences occur (i.e., in the tails, the center, etc.). If you are specifically interested in the center, you may want to define what you mean by "center" and perform a test (e.g., t-test or KS test) on that specific subset of your data.
A bidirectional promoter is a DNA sequence located between two genes, each of which is transcribed from this shared promoter region but in opposite directions. These type of promoters are particularly common in viruses, especially in those with compact genomes, such as many DNA viruses, where genomic space is at a premium. In viruses, bidirectional promoters can help regulate the simultaneous expression of two genes, which can be critical for the viral lifecycle. Some examples of viruses using bidirectional promoters include Adenovirus, Herpes simplex virus, and the Epstein-Barr virus. For example, in the Epstein-Barr virus, the C promoter (Cp) is a bidirectional promoter that regulates the expression of the EBNA (Epstein-Barr Nuclear Antigen) genes. These genes are essential for the establishment of latent infection.
-
assign each promoter to a prefined class according to Motifs_Count and Avg_Distance_To_TSS_of_Motifs
library(dplyr) data <- read.table("motifs_on_NHDF_LT_K331A_promoters.txt", sep="\t", header=TRUE, stringsAsFactors=FALSE) data$Motif_GRGGC_Count <- as.numeric(data$Motif_GRGGC_Count) data$Motif_GCCYC_Count <- as.numeric(data$Motif_GCCYC_Count) # Add a column for the sum of Motif_GRGGC_Count and Motif_GCCYC_Count data <- data %>% mutate(Motifs_Count = Motif_GRGGC_Count + Motif_GCCYC_Count) # Calculate absolute average Motif_GRGGC distance to TSS data$Avg_Distance_To_TSS_of_Motif_GRGGC <- sapply(strsplit(data$Motif_GRGGC_Center_Positions, ", "), function(x) round(mean(as.numeric(x), na.rm = TRUE))) # Calculate absolute average Motif_GCCYC distance to TSS data$Avg_Distance_To_TSS_of_Motif_GCCYC <- sapply(strsplit(data$Motif_GCCYC_Center_Positions, ", "), function(x) round(mean(as.numeric(x), na.rm = TRUE))) # Revised function to calculate the mean of two strings of comma-separated numbers mean_of_strings <- function(str1, str2) { # Convert strings of numbers to numeric vectors vec1 <- as.numeric(strsplit(str1, split = ",")[[1]]) vec2 <- as.numeric(strsplit(str2, split = ",")[[1]]) # Handle cases where vec1 or vec2 is NULL (i.e., when str1 or str2 is an empty string) if (is.null(vec1)) { vec1 <- numeric(0) } if (is.null(vec2)) { vec2 <- numeric(0) } # Compute the mean of the two vectors return(round(mean(c(vec1, vec2), na.rm = TRUE))) } # Apply the function to each row of the dataframe data$Avg_Distance_To_TSS_of_Motifs <- mapply(mean_of_strings, data$Motif_GRGGC_Center_Positions, data$Motif_GCCYC_Center_Positions) # Assign classes based on the given rules data <- data %>% mutate( Class_based_Motif_GRGGC = case_when( Motif_GRGGC_Count < 50 & abs(Avg_Distance_To_TSS_of_Motif_GRGGC) <= 500 ~ "Class 1", Motif_GRGGC_Count < 50 & abs(Avg_Distance_To_TSS_of_Motif_GRGGC) > 500 & abs(Avg_Distance_To_TSS_of_Motif_GRGGC) <= 1000 ~ "Class 2", Motif_GRGGC_Count < 50 & abs(Avg_Distance_To_TSS_of_Motif_GRGGC) > 1000 ~ "Class 3", Motif_GRGGC_Count >= 50 & Motif_GRGGC_Count < 100 & abs(Avg_Distance_To_TSS_of_Motif_GRGGC) <= 500 ~ "Class 4", Motif_GRGGC_Count >= 50 & Motif_GRGGC_Count < 100 & abs(Avg_Distance_To_TSS_of_Motif_GRGGC) > 500 & abs(Avg_Distance_To_TSS_of_Motif_GRGGC) <= 1000 ~ "Class 5", Motif_GRGGC_Count >= 50 & Motif_GRGGC_Count < 100 & abs(Avg_Distance_To_TSS_of_Motif_GRGGC) > 1000 ~ "Class 6", Motif_GRGGC_Count >= 100 & Motif_GRGGC_Count < 150 & abs(Avg_Distance_To_TSS_of_Motif_GRGGC) <= 500 ~ "Class 7", Motif_GRGGC_Count >= 100 & Motif_GRGGC_Count < 150 & abs(Avg_Distance_To_TSS_of_Motif_GRGGC) > 500 & abs(Avg_Distance_To_TSS_of_Motif_GRGGC) <= 1000 ~ "Class 8", Motif_GRGGC_Count >= 100 & Motif_GRGGC_Count < 150 & abs(Avg_Distance_To_TSS_of_Motif_GRGGC) > 1000 ~ "Class 9" ) ) data <- data %>% mutate( Class_based_Motif_GCCYC = case_when( Motif_GCCYC_Count < 50 & abs(Avg_Distance_To_TSS_of_Motif_GCCYC) <= 500 ~ "Class 1", Motif_GCCYC_Count < 50 & abs(Avg_Distance_To_TSS_of_Motif_GCCYC) > 500 & abs(Avg_Distance_To_TSS_of_Motif_GCCYC) <= 1000 ~ "Class 2", Motif_GCCYC_Count < 50 & abs(Avg_Distance_To_TSS_of_Motif_GCCYC) > 1000 ~ "Class 3", Motif_GCCYC_Count >= 50 & Motif_GCCYC_Count < 100 & abs(Avg_Distance_To_TSS_of_Motif_GCCYC) <= 500 ~ "Class 4", Motif_GCCYC_Count >= 50 & Motif_GCCYC_Count < 100 & abs(Avg_Distance_To_TSS_of_Motif_GCCYC) > 500 & abs(Avg_Distance_To_TSS_of_Motif_GCCYC) <= 1000 ~ "Class 5", Motif_GCCYC_Count >= 50 & Motif_GCCYC_Count < 100 & abs(Avg_Distance_To_TSS_of_Motif_GCCYC) > 1000 ~ "Class 6", Motif_GCCYC_Count >= 100 & Motif_GCCYC_Count < 150 & abs(Avg_Distance_To_TSS_of_Motif_GCCYC) <= 500 ~ "Class 7", Motif_GCCYC_Count >= 100 & Motif_GCCYC_Count < 150 & abs(Avg_Distance_To_TSS_of_Motif_GCCYC) > 500 & abs(Avg_Distance_To_TSS_of_Motif_GCCYC) <= 1000 ~ "Class 8", Motif_GCCYC_Count >= 100 & Motif_GCCYC_Count < 150 & abs(Avg_Distance_To_TSS_of_Motif_GCCYC) > 1000 ~ "Class 9" ) ) data <- data %>% mutate( Class_based_Motifs = case_when( Motifs_Count < 50 & abs(Avg_Distance_To_TSS_of_Motifs) <= 500 ~ "Class 1", Motifs_Count < 50 & abs(Avg_Distance_To_TSS_of_Motifs) > 500 & abs(Avg_Distance_To_TSS_of_Motifs) <= 1000 ~ "Class 2", Motifs_Count < 50 & abs(Avg_Distance_To_TSS_of_Motifs) > 1000 ~ "Class 3", Motifs_Count >= 50 & Motifs_Count < 100 & abs(Avg_Distance_To_TSS_of_Motifs) <= 500 ~ "Class 4", Motifs_Count >= 50 & Motifs_Count < 100 & abs(Avg_Distance_To_TSS_of_Motifs) > 500 & abs(Avg_Distance_To_TSS_of_Motifs) <= 1000 ~ "Class 5", Motifs_Count >= 50 & Motifs_Count < 100 & abs(Avg_Distance_To_TSS_of_Motifs) > 1000 ~ "Class 6", Motifs_Count >= 100 & Motifs_Count < 150 & abs(Avg_Distance_To_TSS_of_Motifs) <= 500 ~ "Class 7", Motifs_Count >= 100 & Motifs_Count < 150 & abs(Avg_Distance_To_TSS_of_Motifs) > 500 & abs(Avg_Distance_To_TSS_of_Motifs) <= 1000 ~ "Class 8", Motifs_Count >= 100 & Motifs_Count < 150 & abs(Avg_Distance_To_TSS_of_Motifs) > 1000 ~ "Class 9" ) ) # Define the desired column order desired_columns <- c("PromoterID","Gene_Symbol","Gene_Type","Motif_GRGGC_Count","Motif_GRGGC_Center_Positions","Avg_Distance_To_TSS_of_Motif_GRGGC","Class_based_Motif_GRGGC", "Motif_GCCYC_Count","Motif_GCCYC_Center_Positions","Avg_Distance_To_TSS_of_Motif_GCCYC","Class_based_Motif_GCCYC", "Motifs_Count","Avg_Distance_To_TSS_of_Motifs","Class_based_Motifs") # Reorder the columns data <- select(data, all_of(desired_columns)) #sed -i 's/Motifs/Motifs_GRGGC+GCCYC/g' motifs_in_promoters_with_LT_peak_Category.txt write.table(data, file="motifs_on_NHDF_LT_K331A_promoters_with_Category.txt", sep="\t", row.names = FALSE) #~/Tools/csv2xls-0.4/csv_to_xls.py motifs_on_NHDF_LT_promoters_with_Category.txt -d$'\t' -o motifs_on_NHDF_LT_promoters_with_Category.xls; #~/Tools/csv2xls-0.4/csv_to_xls.py motifs_on_NOT_NHDF_LT_promoters_with_Category.txt -d$'\t' -o motifs_on_NOT_NHDF_LT_promoters_with_Category.xls; #~/Tools/csv2xls-0.4/csv_to_xls.py motifs_on_NHDF_LT_K331A_promoters_with_Category.txt -d$'\t' -o motifs_on_NHDF_LT_K331A_promoters_with_Category.xls; -
calculate the average positions and counts aggregated by PromoterID from the data data3_positions.
library(dplyr) data1_motif2 <- data1_motif2 %>% mutate(Position = as.numeric(Position)) avg_positions <- data1_motif2 %>% group_by(PromoterID) %>% summarise(avg_position = mean(Position, na.rm = TRUE)) print(avg_positions) average_of_avg_positions <- mean(avg_positions$avg_position, na.rm = TRUE) print(average_of_avg_positions) #67.82571 #21.56232 library(dplyr) data2_motif2 <- data2_motif2 %>% mutate(Position = as.numeric(Position)) avg_positions <- data2_motif2 %>% group_by(PromoterID) %>% summarise(avg_position = mean(Position, na.rm = TRUE)) print(avg_positions) average_of_avg_positions <- mean(avg_positions$avg_position, na.rm = TRUE) print(average_of_avg_positions) #20.62934 #13.99134 library(dplyr) data3_motif2 <- data3_motif2 %>% mutate(Position = as.numeric(Position)) avg_positions <- data3_motif2 %>% group_by(PromoterID) %>% summarise(avg_position = mean(Position, na.rm = TRUE)) print(avg_positions) average_of_avg_positions <- mean(avg_positions$avg_position, na.rm = TRUE) print(average_of_avg_positions) #15.3197 #-44.15695 library(dplyr) avg_counts <- data3_motif2 %>% group_by(PromoterID) %>% summarise(count = n()) %>% summarise(avg_count = mean(count)) print(avg_counts) #22.6 #18.8 #19.6 #22.2 #18.5 #19.1 -
Analysis Summary of "GRGGC" and "CYCCG" Motifs in Promoters. I summarized the process of how I analyzed the 'GRGGC' and 'CYCCG' motifs in promoters. In this analysis, our primary focus was to study the distribution of these two specific motifs.
-
The first stage of the analysis was to extract all promoter sequences. A range of 3000 nt upstream to 3000 nt downstream of the Transcription Start Sites (TSS) was selected for this purpose. In total, we were able to identify 62703 promoters, each spanning a length of 6000 nt.
-
We classified these 62703 promoters into three distinct sets:
- 'NHDF_LT': Comprises promoters with at least one NHDF LT peak. This set contains a total of 1706 promoters.
- 'NOT_NHDF_LT': Consists of promoters without any NHDF LT peaks, totaling 60997 promoters.
-
'NHDF_LT_K331A': Contains promoters with NHDF LT K331A peaks, amounting to 310 promoters.
-
Subsequently, we screened the extracted promoter sequences from these three promoter sets for occurrences of the "GRGGC" and "CYCCG" motifs. The results are in three separate files: motifs_on_NHDF_LT_promoters_with_Category.xls, motifs_on_NOT_NHDF_LT_promoters_with_Category.xls.zip, and motifs_on_NHDF_LT_K331A_promoters_with_Category.xls.
-
The next step was to calculate the average counts of both motifs across the three promoter datasets. Interestingly, the average counts revealed that the 'NHDF_LT' set had slightly higher counts for both "GRGGC" and "CYCCG" motifs as compared to the 'NOT_NHDF_LT' and 'NHDF_LT_K331A' sets. The specific averages were as follows:
-
GRGGC in 'NHDF_LT' promoters: 22.6
- GRGGC in 'NOT_NHDF_LT' promoters: 18.8
- GRGGC in 'NHDF_LT_K331A' promoters: 19.6
- CYCCG in 'NHDF_LT' promoters: 22.2
- CYCCG in 'NOT_NHDF_LT' promoters: 18.5
-
CYCCG in 'NHDF_LT_K331A' promoters: 19.1
-
In order to gain deeper insights into the distribution of motifs within the promoters, we generated density plots for all the motifs across the three datasets. A density plot visualizes the distribution of motifs across the promoter regions.
Our analysis of the density plots revealed that the motifs within the 'NHDF_LT' promoter set are more concentrated near the Transcription Start Sites (TSS) compared to the other sets.
In the file titled 'Density_of_GRGGC_Motifs.png', three statistical tests were conducted
- The adjusted p-value between 'NHDF_LT' (left) and 'NOT_NHDF_LT' (middle) was found to be 2.2e-16, indicating statistical significance.
- The adjusted p-value between 'NHDF_LT' (left) and 'NHDF_LT_K331A' (right) was 1.4877e-10, also denoting statistical significance.
- The adjusted p-value between 'NOT_NHDF_LT' (middle) and 'NHDF_LT_K331A' (right) was 0.237, which is not statistically significant.
In a similar manner, three statistical tests were performed for the 'Density_of_GCCYC_Motifs.png' file:
- The adjusted p-value between 'NHDF_LT' (left) and 'NOT_NHDF_LT' (middle) was 1.3323e-15, which is statistically significant.
- The adjusted p-value between 'NHDF_LT' (left) and 'NHDF_LT_K331A' (right) was 1.2147e-06, indicating statistical significance.
- The adjusted p-value between 'NOT_NHDF_LT' (middle) and 'NHDF_LT_K331A' (right) was 0.088, which is not statistically significant.
-
点赞本文的读者
还没有人对此文章表态
本文有评论
没有评论
看文章,发评论,不要沉默
最受欢迎文章
- Motif Discovery in Biological Sequences: A Comparison of MEME and HOMER
- Calling peaks using findPeaks of HOMER
- Kraken2 Installation and Usage Guide
- Why Do Significant Gene Lists Change After Adding Additional Conditions in Differential Gene Expression Analysis?
- Should the inputs for GSVA be normalized or raw?
- PiCRUST2 Pipeline for Functional Prediction and Pathway Analysis in Metagenomics
- Updating Human Gene Identifiers using Ensembl BioMart: A Step-by-Step Guide
- pheatmap vs heatmap.2
- Setup conda environments
- Guide to Submitting Data to GEO (Gene Expression Omnibus)
最新文章
- Risks of Rebooting into Rescue Mode
- 足突(Podosome)、胞外囊泡(Extracellular Vesicle)与基质金属蛋白酶(MMPs)综合解析
- NCBI BioSample Submission Strategy for PJI and Nasal Microbiota Study
- Human RNA-seq processing for Data_Ben_RNAseq_2025
最多评论文章
- Updating Human Gene Identifiers using Ensembl BioMart: A Step-by-Step Guide
- The top 10 genes
- Retrieving KEGG Genes Using Bioservices in Python


