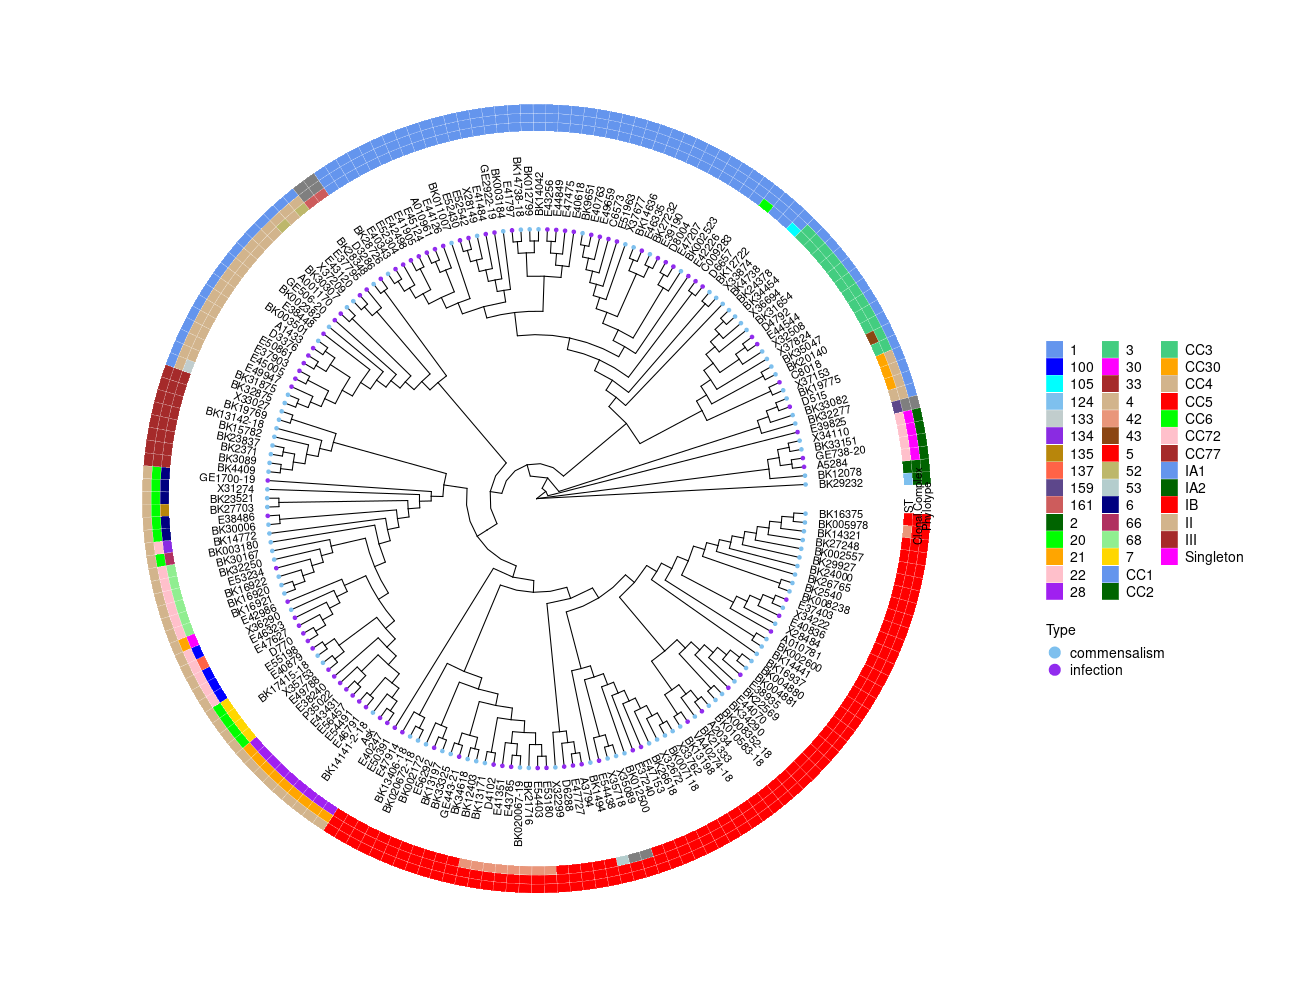
plot treeHeatmap using ggtree
gene_x 0 like s 1492 view s
Tags: plot, R, scripts
library(ggtree)
library(ggplot2)

setwd("/home/jhuang/DATA/Data_Luise_Epidome_batch3/plotTreeHeatmap/")

# -- edit tree --
#https://icytree.org/
info <- read.csv("typing_189.csv")
info$name <- info$Isolate
#tree <- read.tree("core_gene_alignment_fasttree_directly_from_186isoaltes.tree")  --> NOT GOOD!
tree <- read.tree("471.tree")
cols <- c(infection='purple2', commensalism='skyblue2')

library(dplyr)
heatmapData2 <- info %>% select(Isolate, ST, Clonal.Complex, Phylotype)
rn <- heatmapData2$Isolate
heatmapData2$Isolate <- NULL
heatmapData2 <- as.data.frame(sapply(heatmapData2, as.character))
rownames(heatmapData2) <- rn

#https://bookdown.org/hneth/ds4psy/D-3-apx-colors-basics.html
heatmap.colours <- c("cornflowerblue","darkgreen","seagreen3","tan","red",  "navyblue", "gold",     "green","orange","pink","purple","magenta","brown", "darksalmon","chocolate4","darkkhaki", "lightcyan3", "maroon","lightgreen",     "blue","cyan", "skyblue2", "azure3","blueviolet","darkgoldenrod",  "tomato","mediumpurple4","indianred",
                      "cornflowerblue","darkgreen","seagreen3","tan","red","green","orange","pink","brown","magenta",     "cornflowerblue","darkgreen","red","tan","brown",      "darkgrey")
names(heatmap.colours) <- c("1","2","3","4","5", "6","7",   "20","21","22", "28","30","33","42","43","52","53", "66","68",    "100","105","124","133","134","135","137",     "159","161",    "CC1","CC2","CC3","CC4","CC5","CC6","CC30","CC72","CC77","Singleton",    "IA1","IA2","IB","II","III",    "NA")
#mydat$Regulation <- factor(mydat$Regulation, levels=c("up","down"))

#circular
p <- ggtree(tree, layout='circular', branch.length='none') %<+% info +
  geom_tippoint(aes(color=Type)) +
  scale_color_manual(values=cols) + geom_tiplab2(aes(label=name), offset=1)
#, geom='text', align=TRUE,  linetype=NA, hjust=1.8,check.overlap=TRUE, size=3.3
#difference between geom_tiplab and geom_tiplab2?
#+ theme(axis.text.x = element_text(angle = 30, vjust = 0.5)) + theme(axis.text = element_text(size = 20))  + scale_size(range = c(1, 20))
#font.size=10,
png("ggtree.png", width=1260, height=1260)
#svg("ggtree.svg", width=1260, height=1260)
p
dev.off()

png("ggtree_and_gheatmap.png", width=1290, height=1000)
#svg("ggtree_and_gheatmap.svg", width=1290, height=1000)
#svg("ggtree_and_gheatmap.svg", width=17, height=15)
gheatmap(p, heatmapData2, width=0.1,colnames_position="top", colnames_angle=90, colnames_offset_y = 0.1, hjust=0.5, font.size=4, offset = 8) + scale_fill_manual(values=heatmap.colours) +  theme(legend.text = element_text(size = 14)) + theme(legend.title = element_text(size = 14)) + guides(fill=guide_legend(title=""), color = guide_legend(override.aes = list(size = 5)))
dev.off()
点赞本文的读者
还没有人对此文章表态
本文有评论
没有评论
看文章,发评论,不要沉默
最受欢迎文章
- Motif Discovery in Biological Sequences: A Comparison of MEME and HOMER
- Calling peaks using findPeaks of HOMER
- Kraken2 Installation and Usage Guide
- Why Do Significant Gene Lists Change After Adding Additional Conditions in Differential Gene Expression Analysis?
- Should the inputs for GSVA be normalized or raw?
- PiCRUST2 Pipeline for Functional Prediction and Pathway Analysis in Metagenomics
- Updating Human Gene Identifiers using Ensembl BioMart: A Step-by-Step Guide
- pheatmap vs heatmap.2
- Setup conda environments
- Guide to Submitting Data to GEO (Gene Expression Omnibus)
最新文章
- Risks of Rebooting into Rescue Mode
- 足突(Podosome)、胞外囊泡(Extracellular Vesicle)与基质金属蛋白酶(MMPs)综合解析
- NCBI BioSample Submission Strategy for PJI and Nasal Microbiota Study
- Human RNA-seq processing for Data_Ben_RNAseq_2025
最多评论文章
- Updating Human Gene Identifiers using Ensembl BioMart: A Step-by-Step Guide
- The top 10 genes
- Retrieving KEGG Genes Using Bioservices in Python
推荐相似文章
Gene Set Variation Analysis (GSVA) and Visualization of Gene Sets from Excel Signatures
Generation of Heatmap from DEGs Data and Annotation of Identified Gene Clusters
