Extract beta-diversity from the Phyloseq results
gene_x 0 like s 992 view s
Tags: metagenomics
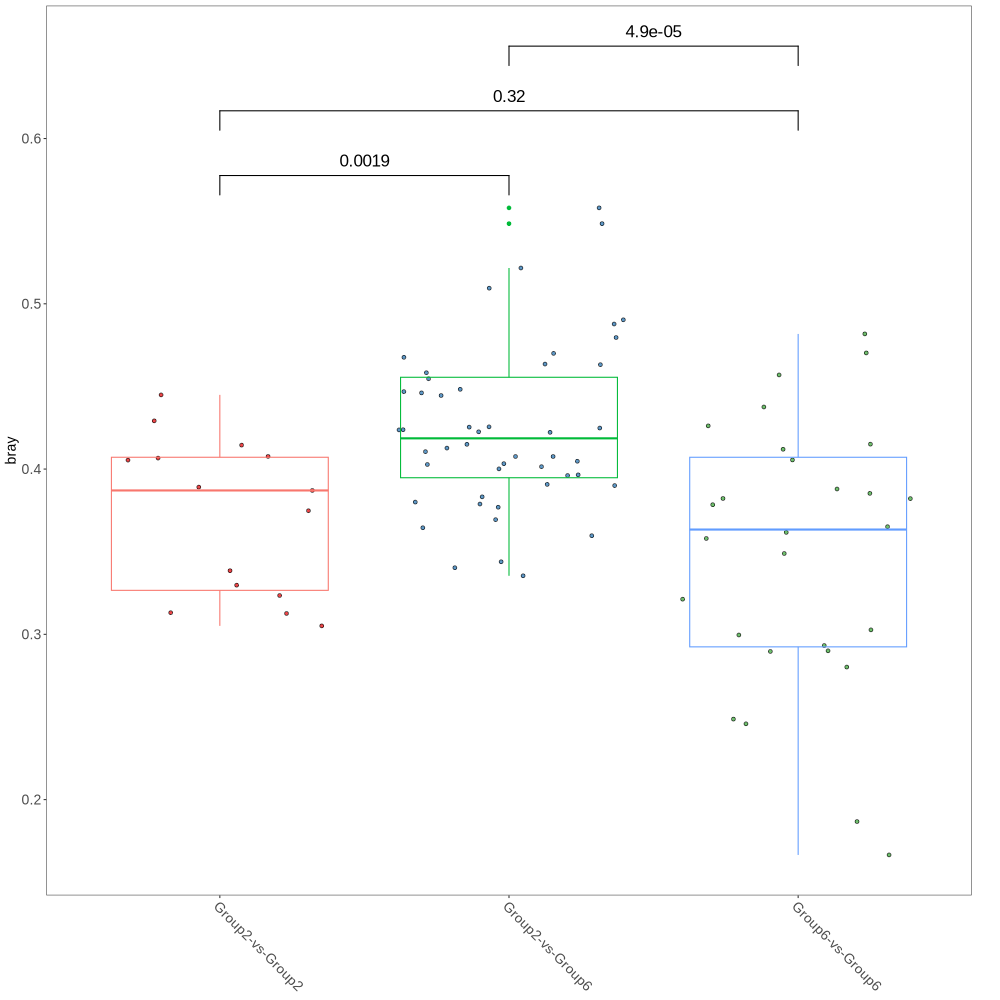
I'm pleased to know the graphs have been useful. There is a significant difference in beta diversity between Group 2 and Group 6, as demonstrated by the PCA analysis and the attached boxplot. This plot clearly shows significant differences in beta diversity within Group 2 and Group 6, as well as between the two groups. The pairwise Bray-Curtis distances indicate substantial variability when comparing the distances from Group 2 to Group 6 against the distances within each group itself (Group 2 vs. Group 2 and Group 6 vs. Group 6). Additionally, I have included the pairwise Bray-Curtis distance values in an Excel table for the figure.
In line with the principle of beta diversity, we expect the diversity between samples from different groups to be greater than the diversity within groups. Based on this principle, the adjusted p-values for the first two comparisons should be small (e.g., < 0.05), while the last value should approach 1. However, as per the standard, the beta diversity comparisons in Group1_vs_Group5, Group4_vs_Group8, and Group3_vs_Group7 are not significant (see details below).
    # in the file ~/DATA/Data_Marius_16S/core_diversity_e42369/bdiv_even42369_Group/unweighted_unifrac_boxplots/Group_Stats.txt

    #Group2_vs_Group6
    Group2_vs_Group2       Group6_vs_Group2       -3.79732911184  0.000339270171256 (0.0019)      0.238506930393
    Group6_vs_Group6       Group6_vs_Group2       -4.28406536899  5.44434521753e-05 (4.9e-5)       0.0382737468793
    Group6_vs_Group6       Group2_vs_Group2       -0.309361435009 0.758613384091 (0.32)  1

    #Group1_vs_Group5
    Beta-diversity1 Beta-diversity2 t-statistic p-value Bonferroni-corrected p-value
    Group1_vs_Group1    Group5_vs_Group1    2.00417798376   0.0548104465256 1
    Group5_vs_Group5    Group5_vs_Group1    -3.25546483256  0.00335706567643    1
    Group5_vs_Group5    Group1_vs_Group1    -3.32676003333  0.00498942378132    1

    #Group4_vs_Group8
    Group4_vs_Group4    Group4_vs_Group8    1.05703763767   0.293598585458  1
    Group8_vs_Group8    Group4_vs_Group8    -2.81684107057  0.00619523703667    1
    Group4_vs_Group4    Group8_vs_Group8    3.60722199799   0.00074734776948    0.525385481945

    #Group3_vs_Group7
    Group7_vs_Group7    Group7_vs_Group3    -1.69330299127  0.0967469273622 1
    Group3_vs_Group3    Group7_vs_Group3    1.83751562431   0.07220131956   1

    #0.0003  0.2109
    #0.0002  0.1406
    #0.7601  1.0000

    #0.0590  1.0000
    #0.0033  1.0000
    #0.0066  1.0000

    #0.2950  1.0000
    #0.0063  1.0000
    #0.0007  0.4921

    #0.0945  1.0000
    #0.0684  1.0000
    #0.0155  1.0000
For pathway analysis, when we set the p-value threshold to < 0.01, no pathways were found to be enriched between Group1 and Group5, Group4 and Group8, or Group3 and Group7.
点赞本文的读者
还没有人对此文章表态
本文有评论
没有评论
看文章,发评论,不要沉默
最受欢迎文章
- Motif Discovery in Biological Sequences: A Comparison of MEME and HOMER
- Calling peaks using findPeaks of HOMER
- Kraken2 Installation and Usage Guide
- Why Do Significant Gene Lists Change After Adding Additional Conditions in Differential Gene Expression Analysis?
- Should the inputs for GSVA be normalized or raw?
- PiCRUST2 Pipeline for Functional Prediction and Pathway Analysis in Metagenomics
- pheatmap vs heatmap.2
- Updating Human Gene Identifiers using Ensembl BioMart: A Step-by-Step Guide
- Setup conda environments
- Guide to Submitting Data to GEO (Gene Expression Omnibus)
最新文章
- Risks of Rebooting into Rescue Mode
- 足突(Podosome)、胞外囊泡(Extracellular Vesicle)与基质金属蛋白酶(MMPs)综合解析
- NCBI BioSample Submission Strategy for PJI and Nasal Microbiota Study
- Human RNA-seq processing for Data_Ben_RNAseq_2025
最多评论文章
- Updating Human Gene Identifiers using Ensembl BioMart: A Step-by-Step Guide
- The top 10 genes
- Retrieving KEGG Genes Using Bioservices in Python
推荐相似文章
QIIME + Phyloseq + MicrobiotaProcess (v1)
Clinical metagenomics [Talks for Shenzhen and so on]
