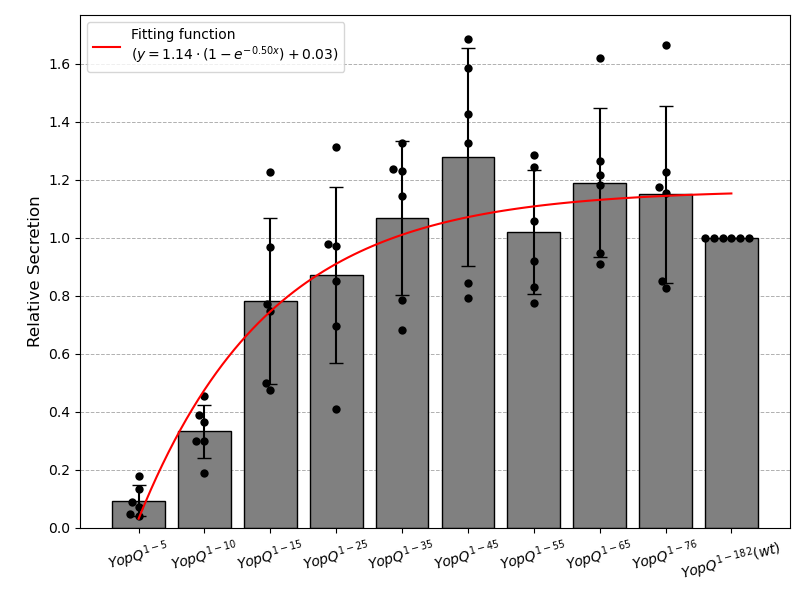
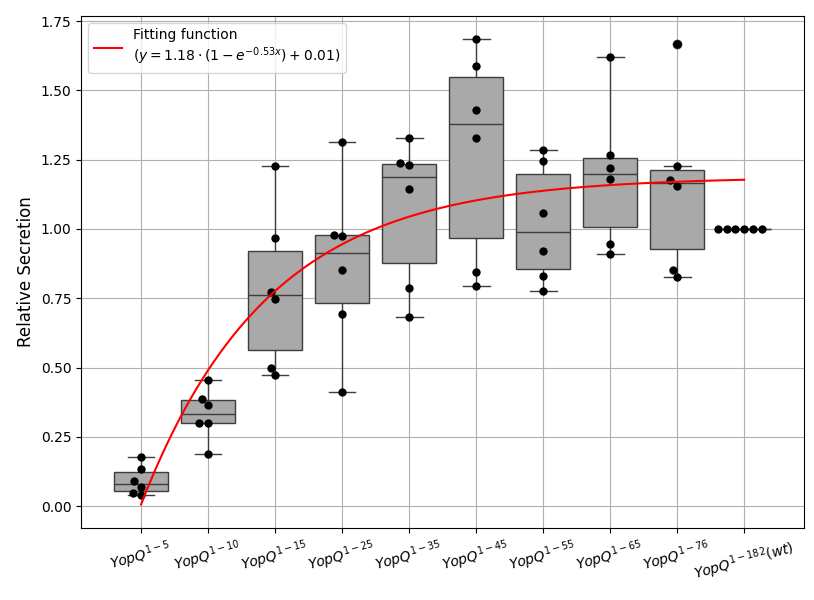
YopQ Secretion Boxplot and Fitting Function
gene_x 0 like s 969 view s
Tags: plot, python
import pandas as pd
import numpy as np
import matplotlib.pyplot as plt
from scipy.optimize import curve_fit
import seaborn as sns

# Sample data
data = {
    "Sample": ["1 (04.10.23)", "2 (27.20.23)", "3 (30.11.23)", "1 (SR003)", "2 (SR004)", "3 (SR021)"],
    "YopQ1-5": [0.17864353, 0.08980754, 0.13318754, 0.039536, 0.07075792, 0.04852611],
    "YopQ1-10": [0.3663838, 0.45519364, 0.29828942, 0.18891885, 0.38740741, 0.30086734],
    "YopQ1-15": [0.49962418, 0.96844132, 0.77290941, 0.4739692, 0.74691256, 1.22698631],
    "YopQ1-25": [0.9791465, 0.85120313, 0.97336014, 0.4107113, 1.31386354, 0.69474945],
    "YopQ1-35": [1.32707017, 1.23130563, 1.23649531, 0.68362804, 0.78614696, 1.14339001],
    "YopQ1-45": [1.42828421, 1.32843428, 1.68480714, 0.84469081, 0.79365431, 1.58619928],
    "YopQ1-55": [0.83107654, 1.24622023, 0.92185733, 1.05695509, 0.77422497, 1.28645523],
    "YopQ1-65": [1.62036726, 1.21848867, 0.94667898, 0.91017609, 1.181266, 1.2667003],
    "YopQ1-76": [1.22602291, 0.85284654, 1.15612041, 0.82651662, 1.6654101, 1.17553764],
    "YopQ1-182(wt)": [1, 1, 1, 1, 1, 1]
}

# Create DataFrame
df = pd.DataFrame(data)

# Extract columns for plotting
yopq1_columns = df.columns[1:]
x_categories = np.arange(len(yopq1_columns))  # Numeric representation for curve fitting

# Calculate means and standard deviations for the bar plot
means = df.iloc[:, 1:].mean()
stds = df.iloc[:, 1:].std()

# Create the bar plot with error bars
plt.figure(figsize=(12, 6))
plt.bar(x_categories, means, yerr=stds, color='grey', capsize=5, edgecolor="black", zorder=2)

# Add jittered points using swarmplot for visualizing individual data points
sns.swarmplot(data=df.iloc[:, 1:], color="black", size=6, zorder=3, edgecolor="white")

# Define exponential plateau function
def plateau_exponential_func(x, a, b, c):
    return a * (1 - np.exp(-b * x)) + c

# Fit data using the mean of each group
popt, _ = curve_fit(plateau_exponential_func, x_categories, means.values, p0=[1, 0.1, 0.5], maxfev=10000)

# Generate fit curve data
x_fit = np.linspace(0, len(yopq1_columns) - 1, 100)
y_fit = plateau_exponential_func(x_fit, *popt)

# Plot fitting curve
plt.plot(x_fit, y_fit, 'r-', label=f'Fitting function\n($y = {popt[0]:.2f} \\cdot (1 - e^{{-{popt[1]:.2f}x}}) + {popt[2]:.2f}$)', zorder=4)

# Update labels and styles
plt.ylabel('Relative Secretion', fontsize=12)
plt.xticks(ticks=x_categories, labels=[
    '$YopQ^{1-5}$', '$YopQ^{1-10}$', '$YopQ^{1-15}$', '$YopQ^{1-25}$',
    '$YopQ^{1-35}$', '$YopQ^{1-45}$', '$YopQ^{1-55}$', '$YopQ^{1-65}$',
    '$YopQ^{1-76}$', '$YopQ^{1-182}(wt)$'
], rotation=15)

# Grid and legend
plt.grid(True, axis='y', linestyle='--', linewidth=0.7, zorder=0)
plt.legend(title='', loc='upper left')
plt.tight_layout()
plt.subplots_adjust(left=0.1)
plt.show()

## Save plot with high resolution
#plt.savefig("high_resolution_plot.png", dpi=300)  # Save with 300 DPI
import pandas as pd
import numpy as np
import matplotlib.pyplot as plt
from scipy.optimize import curve_fit
import seaborn as sns

#Explanation of Key Parts:
#
#    sns.swarmplot: This function automatically adds jitter to the points, ensuring they don't overlap. By setting color="black", the points will be displayed in black, and size=5 sets the size of the points.
#
#    Boxplot: The sns.boxplot is still used to display the boxplot for the data distribution in grey (color="darkgrey").
#
#    Fitting Curve: The exponential curve fitting remains the same as before.
#
#    Legends: The legend for the points has been removed, and only the fitting function legend is shown.
#
#Benefits of Using swarmplot:
#
#    Automatic Jittering: It provides a nice way to scatter points without overlap, as it automatically adjusts the points’ positions along the x-axis.
#    Combining with Boxplot: You can easily combine it with the boxplot for showing both the distribution and the individual points.

# 数据集
data = {
    "Sample": ["1 (04.10.23)", "2 (27.20.23)", "3 (30.11.23)", "1 (SR003)", "2 (SR004)", "3 (SR021)"],
    "YopQ1-5": [0.17864353, 0.08980754, 0.13318754, 0.039536, 0.07075792, 0.04852611],
    "YopQ1-10": [0.3663838, 0.45519364, 0.29828942, 0.18891885, 0.38740741, 0.30086734],
    "YopQ1-15": [0.49962418, 0.96844132, 0.77290941, 0.4739692, 0.74691256, 1.22698631],
    "YopQ1-25": [0.9791465, 0.85120313, 0.97336014, 0.4107113, 1.31386354, 0.69474945],
    "YopQ1-35": [1.32707017, 1.23130563, 1.23649531, 0.68362804, 0.78614696, 1.14339001],
    "YopQ1-45": [1.42828421, 1.32843428, 1.68480714, 0.84469081, 0.79365431, 1.58619928],
    "YopQ1-55": [0.83107654, 1.24622023, 0.92185733, 1.05695509, 0.77422497, 1.28645523],
    "YopQ1-65": [1.62036726, 1.21848867, 0.94667898, 0.91017609, 1.181266, 1.2667003],
    "YopQ1-76": [1.22602291, 0.85284654, 1.15612041, 0.82651662, 1.6654101, 1.17553764],
    "YopQ1-182(wt)": [1, 1, 1, 1, 1, 1]
}

# 创建DataFrame
df = pd.DataFrame(data)

# 抽取YopQ1列
yopq1_columns = df.columns[1:]
x_categories = np.arange(len(yopq1_columns))  # 数值化类别索引

# 创建箱线图(灰色)
plt.figure(figsize=(12, 6))
sns.boxplot(data=df.iloc[:, 1:], color="darkgrey", zorder=2)  # Boxplot in dark grey

# Add jittered points using swarmplot (black points)
sns.swarmplot(data=df.iloc[:, 1:], color="black", size=6, zorder=3)  # Swarmplot adds jitter

# 定义指数趋近函数
def plateau_exponential_func(x, a, b, c):
    return a * (1 - np.exp(-b * x)) + c

# 计算每个类别中值并进行拟合
y_data = df.iloc[:, 1:].median().values

# 拟合指数趋近模型
popt, pcov = curve_fit(plateau_exponential_func, x_categories, y_data, p0=[1, 0.1, 0.5], maxfev=10000)
a, b, c = popt

# 生成拟合曲线数据
x_fit = np.linspace(0, len(yopq1_columns) - 1, 100)
y_fit = plateau_exponential_func(x_fit, a, b, c)

# 绘制拟合曲线
plt.plot(x_fit, y_fit, 'r-', label=f'Fitting function\n($y = {a:.2f} \\cdot (1 - e^{{-{b:.2f}x}}) + {c:.2f}$)', zorder=4)

# 更新轴标签
plt.xlabel('')   #YopQ1 (Categories)
plt.ylabel('Relative Secretion', fontsize=12)
plt.title('')    #Boxplot of YopQ1 Measurements with Plateau Exponential Fit and Raw Data

# 显示类别标签
labels = ['$YopQ^{1-5}$', '$YopQ^{1-10}$', '$YopQ^{1-15}$', '$YopQ^{1-25}$', '$YopQ^{1-35}$', '$YopQ^{1-45}$', '$YopQ^{1-55}$', '$YopQ^{1-65}$', '$YopQ^{1-76}$', '$YopQ^{1-182}(wt)$']
plt.xticks(ticks=x_categories, labels=labels, rotation=15)

# Remove the legend for the points, keep for fitting function
plt.legend(title='', loc='upper left')  # Only keep the legend for the fitting function

plt.grid(True)
plt.tight_layout()
plt.subplots_adjust(left=0.1)  # Increase the left margin to avoid cutting off ylabel
plt.show()

## Create a figure with specified size
#fig = plt.figure(figsize=(12, 9))  # (12, 9) corresponds to 1200x900 in pixels at 100 dpi
## Your plotting code goes here (e.g., boxplot, scatter plot, etc.)
## Save as PNG
#fig.savefig("plot.png", dpi=100)  # The dpi is 100, so figsize=(12, 9) will be 1200x900 pixels
## Save as SVG
#fig.savefig("plot.svg")
## Close the plot to release resources
#plt.close(fig)
点赞本文的读者
还没有人对此文章表态
本文有评论
没有评论
看文章,发评论,不要沉默
最受欢迎文章
- Motif Discovery in Biological Sequences: A Comparison of MEME and HOMER
- Calling peaks using findPeaks of HOMER
- Kraken2 Installation and Usage Guide
- Why Do Significant Gene Lists Change After Adding Additional Conditions in Differential Gene Expression Analysis?
- Should the inputs for GSVA be normalized or raw?
- PiCRUST2 Pipeline for Functional Prediction and Pathway Analysis in Metagenomics
- Updating Human Gene Identifiers using Ensembl BioMart: A Step-by-Step Guide
- pheatmap vs heatmap.2
- Setup conda environments
- Guide to Submitting Data to GEO (Gene Expression Omnibus)
最新文章
- Risks of Rebooting into Rescue Mode
- 足突(Podosome)、胞外囊泡(Extracellular Vesicle)与基质金属蛋白酶(MMPs)综合解析
- NCBI BioSample Submission Strategy for PJI and Nasal Microbiota Study
- Human RNA-seq processing for Data_Ben_RNAseq_2025
最多评论文章
- Updating Human Gene Identifiers using Ensembl BioMart: A Step-by-Step Guide
- The top 10 genes
- Retrieving KEGG Genes Using Bioservices in Python
推荐相似文章
RNA-seq skin organoids on GRCh38+chrHsv1 (final)
Genomic Organization of Herpes Simplex Virus type 1 (HSV-1 s17)

