RNA sequencing data analysis

RNA sequencing data analysis brings to light the intricate mechanisms of gene regulation.
Transcriptome-wide analyses of gene expression are extremely popular among researchers studying gene regulation in biological systems ranging from single cells to tissues and complex microbiomes. RNA-seq data allows for a wide range of analyses to address countless research questions across the fields of biology and biomedicine.
Below we present some of the most common analyses we perform on RNA-seq data. The explorative, differential expression and pathway analyses largely apply to other high-throughput expression data as well, such as expression microarray or proteomic data.
We hope that the examples below inspire you to appreciate just how rich the world of RNA-sequencing is.
Exploratory gene expression analysis
Every RNA-seq expression study incorporates an exploratory analysis. After the raw sequencing reads of an RNA-seq experiment have been quality controlled and gene counts derived, the data set is visualized using Principal Component Analysis (PCA) and expression heatmaps to unveil its general patterns. These visualizations help us answer questions such as:
- Do the biological replicates resemble each other with regards to their expression profiles?
- Do distinct sample groups (e.g., different tissues, treatments or time points) form separate clusters?
- Are there outlier samples?

Differential expression analysis
Differential expression analysis is a statistical comparison of two sample groups. It results in differential expression statistics for each detected transcript, such as the fold change and statistical significance. These statistics are typically visualized using a volcano plot. The genes which are found to be up- or down-regulated can be further visualized as heatmaps or boxplots, for instance.
As a statistical analysis, this phase of an expression study benefits from the statistical power brought by biological replicates. Three biological replicates per condition is a common “rule-of-thumb” minimum, but it only allows for reliable detection of genes with relatively large expression differences. With a careful experimental design and sufficient sample size, subtler differences can be detected and confounding factors controlled for.

Pathway analysis
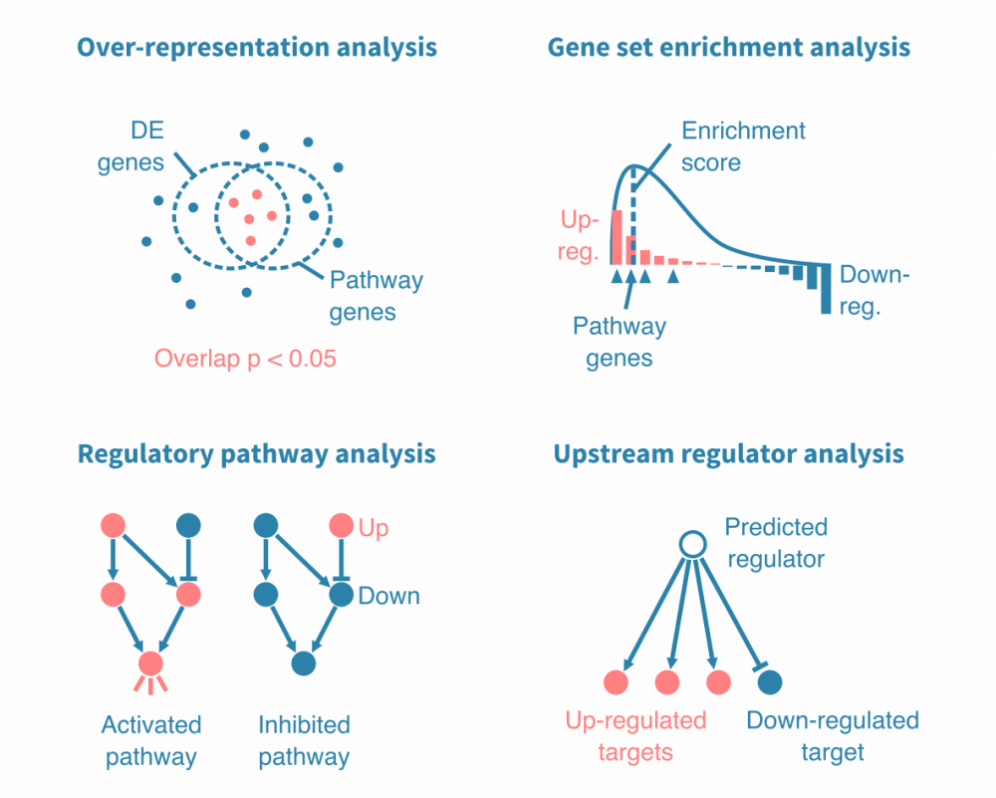
Pathway analysis puts genes from a differential expression analysis into broader biological context. Simple pathway analyses compare the up- and down-regulated genes statistically to predetermined gene lists. These lists are annotated to biologically meaningful terms, such as a biological process, signaling pathway or a specific disease.
Such analyses may rely either on over-representation analysis or gene set enrichment analysis, which both result in a list of enriched gene sets with relevant statistics and annotations.
More mechanistic pathway analyses rely on experimentally validated interactions between genes. They enable identifying not just which pathways are represented by the differentially expressed genes, but also shed light on whether the pathways are activated or inhibited, and by which genes.
For the more avanced pathway analyses, we use Ingenuity Pathway Analysis (IPA, QIAGEN). IPA enables a wide range of in-depth analyses into known and novel gene regulatory networks.
Transcriptome assembly
For non-model organisms, and those with very dynamic genomes, i.e. microbes, we typically start RNA sequencing data analysis with assembling a transcriptome de novo and annotating it using homologues of related species and computational gene predictions.
A new reference transcriptome is an invaluable resource for your further research, and that of the entire research community. Once a high-quality reference transcriptome has been established, the door opens to most downstream analyses which are routinely used with model organisms.
![]()
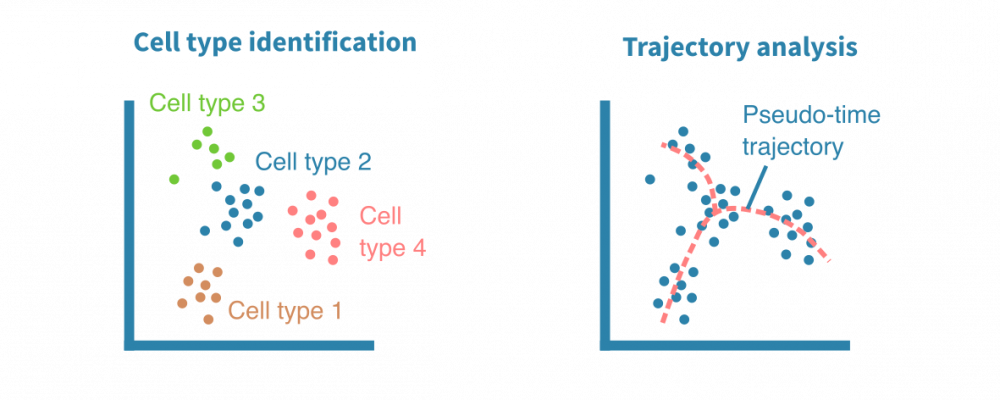
Single-cell expression analysis
Single-cell RNA-sequencing (scRNA-seq) experiments allow for cataloguing cell types and uncovering differentiation trajectories at a scale and resolution unmatched by bulk RNA sequencing.
Used particularly to study the composition and development of complex tissues, scRNA-seq data sets typically comprise thousands of individual cells. Most approaches used to analyze bulk RNA-seq data can be tailored for single-cell RNA-seq data as well.
MicroRNA data analysis
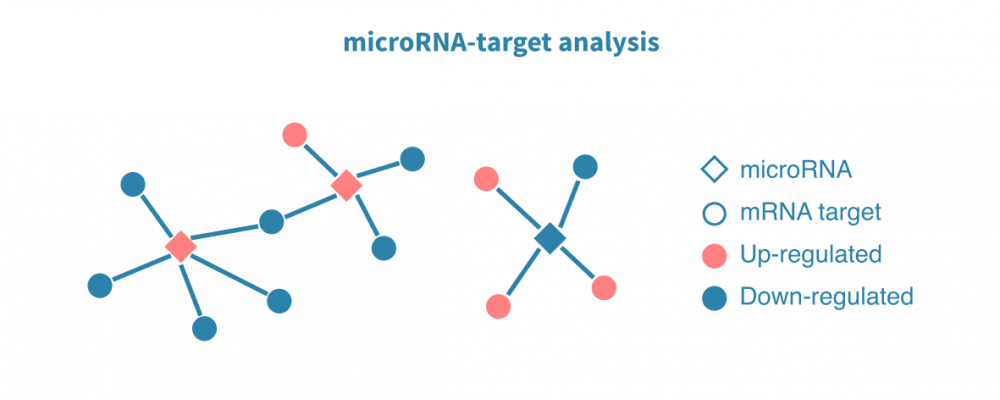
Small RNA-sequencing enables studying various species of short RNAs, and microRNAs in particular. MicroRNA-seq analysis is largely similar to that of mRNAs, but pathway and regulatory analyses make use of predicted and/or previously validated microRNA target genes.
Sequencing both mRNA and small RNA from the matched samples enables estimating the regulatory relationship between microRNAs and their targets. To identify genes subject to microRNA-mediated regulation in a given condition, argonaute CLIP-sequencing (and related protocols) can be employed.
Alternative splicing analysis
In addition to studying expression on the level of genes, RNA-sequencing allows for a more detailed view: splice-variant level expression. Reliable identification of alternative splicing events benefits from deeper sequencing than the typical gene-level expression analysis.
Depending on the quantity and quality of the data, alternative splicing analyses may focus on quantifying expression levels of known, previously annotated splice isoforms, or on detecting novel splicing events as well.

Fusion gene detection
In cancer, certain structural variants are known to cause fusion genes. Two separate genes fused together in the DNA may lead to a fusion transcript. The fusion transcript, in turn, may lead to a fusion protein with a novel, potentially cancer-driving combination of regulation and function.
Fusion genes can be detected from RNA-sequencing data with tools that identify and analyze discordantly mapping RNA-seq reads or read pairs.

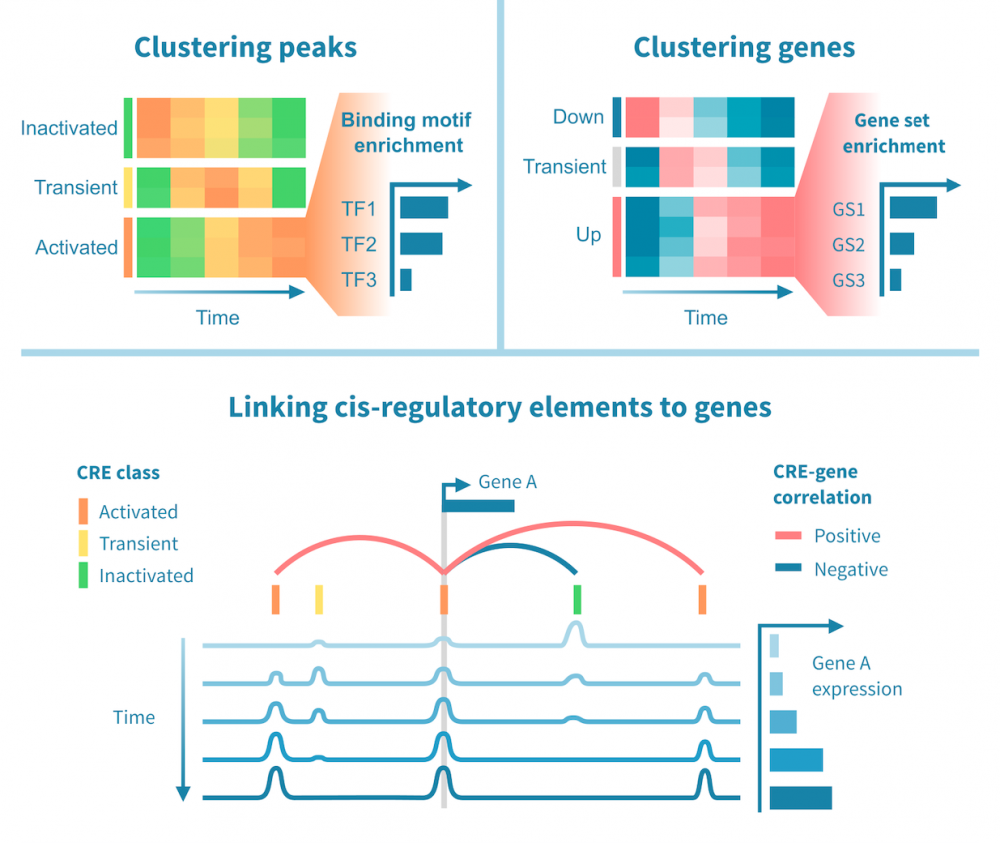
Integrating RNA-seq and epigenomic data
Performing RNA-seq and epigenomic sequencing (such as ChIP or ATAC-seq) on the same samples enables integrative analyses to study gene regulatory programs genome-wide.
Regulatory connections can be identified between enhancers and their target genes, as well as transcription factors and their targets, building on evidence from both gene expression and the epigenomic status of regulatory elements.