Integrative analysis of RNA-seq and ChIP-seq data
"How do you integrate RNA-seq and ChIP-seq data?”
I’ve heard biologists ask the question above countless times. (You may replace ChIP-seq with ATAC-seq, bisulphite-seq or any other epigenomic data type.)
It makes a lot of sense to ask that question.
Generating and analyzing data from a single NGS-based assay such as RNA-seq or ChIP-seq is not as rare a skill as it was a few years ago. This is due to a new "NGS native" generation of biologists who have acquired basic ‘omics data analysis skills early in their training, largely obviating the need for biologists to walk to the department of statistics or — god forbid! — computer science to knock on the doors of code-savvy researchers, suggesting a “collaboration” to get their data analyzed.
However, integrating different data modalities is a different matter, and this is the phase where research projects often stall.
The idea is simple: if you see, smell and taste a wine, your brain may be able to integrate these multi-sensory inputs and infer just which river valley the grapes originate from, way better than if it had to rely on just one sense.
So, what is the multiomic brain that takes all possible NGS data you generate and spits out insight?
The wrong answer, I have learned, is “it really depends on your research question”. The correct one is “correlation”. That is the short answer — the longer one is “careful analysis of individual data types, correlation, filtering, visualization, interpretation — iterate a couple times — and you might arrive at some very fine results!”
The workflow
For a walk-through of this data integration, let us assume an experiment visualized below, with RNA-sequencing and an epigenomic sequencing assay performed at a few timepoints, and a treatment administered after the first time point. The epigenomic assay could be ChIP-seq (or CUT&Tag) for one or more histone modifications, or a chromatin accessibility assay such as ATAC-seq.
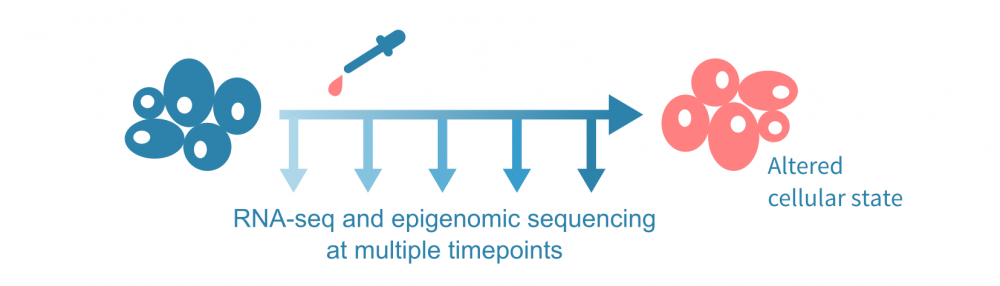
(The integrative analyses discussed here do not require time series data; one could analyze the expression and epigenetic states across a pseudotime trajectory using single-cell data or, simply, comparing single-timepoint data from bulk experiments in different conditions.)
The question is, what are the molecular mechanisms between the treatment and an altered cellular state at the end? Can we give a multi-step description of events cascading through the network of genes and gene products that reprograms the cell to adapt to the perturbation?
In the context of translational research, identifying the critical elements, such as transcription factors or enhancers that enable a cell's progression to a diseased state, offer possible targets for new therapies.
Below we see a workflow for identifying active cis- and trans-regulatory paths in such a cascade. It begins with processing epigenomic and transcriptomic data separately, and brings the two modalities together by correlating the expression of each gene to the signal from its putative cis-regulatory elements (CREs). It then proceeds to identify transcription factors (TFs) which drive the chromatin changes, through identifying TF binding motifs within the CREs and correlating TF expression to the state of these putative binding sites.
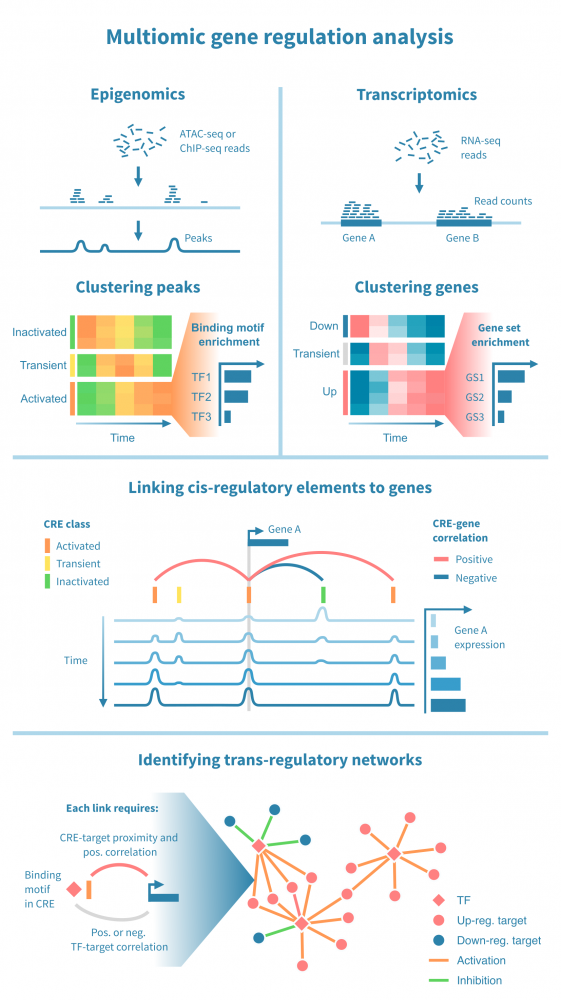
The central steps in the workflow include:
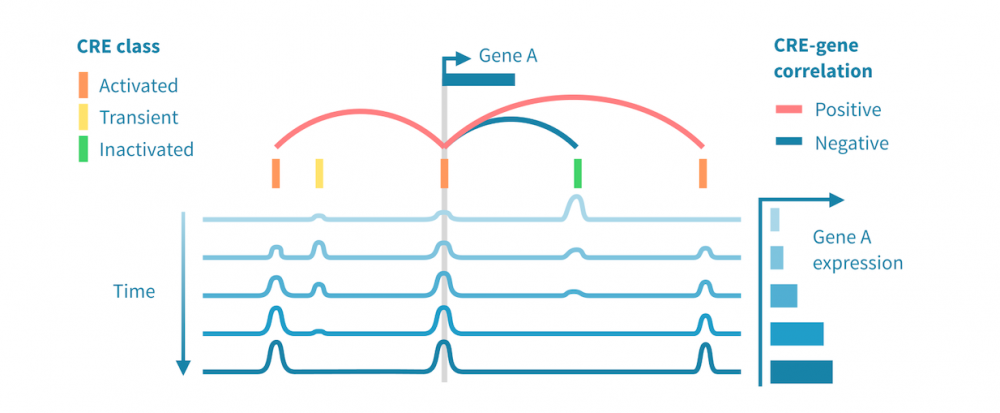
- Classifying cis-regulatory elements. The peaks, interpreted as CREs, can be grouped by their temporal pattern by cluster analysis. This may yield several categories of CREs, whose epigenetic state can be classified based on the observed pattern (e.g., activated, transiently activated, constitutively active) and the epigenomic signal that was measured (e.g., "accessible" in the case of ATAC-seq, "active" in the case of H3K27ac ChIP-seq). The CRE clusters are further annotated by enriched binding motifs.
- Grouping genes by their temporal expression pattern. The genes are likewise grouped by cluster analysis and classified based on the observed patterns (e.g., "up-regulated", "constitutively expressed"). Gene clusters are annotated by gene set enrichment analysis to link them to biological functions and processes.
- Linking CREs to genes. Linking a putative CRE to a gene relies on genomic proximity between the two as well as correlation between the CREs epigenomic activity and the gene's expression.
- Linking TFs to target genes. Establishing a link between a TF and a target gene relies on information on TF-CRE links (binding motifs, correlation) CRE-target gene links (see above) as well as TF-target correlation. Such multiomic filtering of possible TF-target links enables identifying a network of all such active trans-regulatory paths.
What are the follow-up experiments?
The approach described above results in a rich description of regulatory programs involved in a studied process. There are several ways to further enrich and validate the findings, such as:
- Validating CRE-target interactions by chromosome conformation capture. Methods such as Hi-C enable establishing evidence of physical interaction between distant loci, genome-wide.
- Validating the CRE-gene interactions with genome editing. The gold standard experiment to validate a regulatory element's role in driving a gene's expression is to delete the CRE, using CRISPR-Cas9, and quantify the target gene's expression in wild-type and edited cells.
- Validating TF-CRE interactions using ChIP-seq. The mere presence of a binding site in an apparently active regulatory element is not direct evidence of the TF-CRE interaction. A ChIP-seq (or CUT&RUN or CUT&Tag) experiment using an antibody specific for a TF of interest can be used to verify the factor's physical presence.
Learn more
Above we presented an example approach to integrating epigenomic and gene expression data, specifically to uncover cis- and trans-regulatory interactions. Learn more about NGS data analyses: