Epigenomic data analysis

Uncover epigenetic mechanisms of gene regulation in development and disease.
Epigenomics characterizes the chromatin state down to minuscule chemical modifications. Epigenetic changes to the DNA and associated proteins affect gene expression and may lead to altered cellular states, including diseases.
We analyze a wide range of epigenomic sequencing data in order to gain deeper understanding of intra-cellular molecular mechanisms and to identify biomarkers for diseases.
Below we discuss common epigenomic data types and analyses, and present some of our past work involving epigenomic data analysis.
Epigenomic assays
High-throughput assays for epigenomic profiling are numerous, and new protocols are being developed continuously. The most common epigenomic assays focus on DNA methylation, DNA-binding proteins, histone modifications, chromatin accessibility or the 3D conformation of the chromatin.
-
DNA methylation. DNA methylation assays based on bisuplhite-treated DNA enable identifying methylation events at the highest resolution. Such assays use next-generation sequencing (whole-genome or reduced representation bisulphite-sequencing) or microarrays. An alternative approach, MeDIP-sequencing, relies on immunoprecipitation and suffers from lower resolution.
-
Transcription factor binding and histone modifications. Assays to identify DNA-bound proteins such as transcription factors, as well as chemical modifications to the histone proteins, make use of antibodies. ChIP-sequencing is the most common method, but newer alternatives with better resolution have been developed. These include ChIP-exo, Chipmentation, CUT&RUN and CUT&Tag.
-
Chromatin accessibility. The gold standard assay for mapping regions of open chromatin is ATAC-sequencing. ATAC-seq has largely replaced previous methods such as DNase-seq and FAIRE-seq.
-
Chromatin conformation. The importance of the chromatin's three-dimensional conformation has gained particular appreciation recently. Chromatin conformation assays are used to study the physical interactions between genes and their distal regulatory elements as well as the proteins that cause such looping of the chromatin. Hi-C is a typical assay for the former, while ChIA-PET can be applied to the latter.
To study the epigenome's direct effect on gene expression, epigenomic measurements are often complemented with RNA-sequencing experiments in the same setting.
Single-cell experiments, particularly single-cell ATAC-sequencing, is increasingly performed as a co-assay with single-cell RNA-sequencing. This yields gene expression and chromatin accessibility profiles from the same individual cells.

Peak calling and annotation
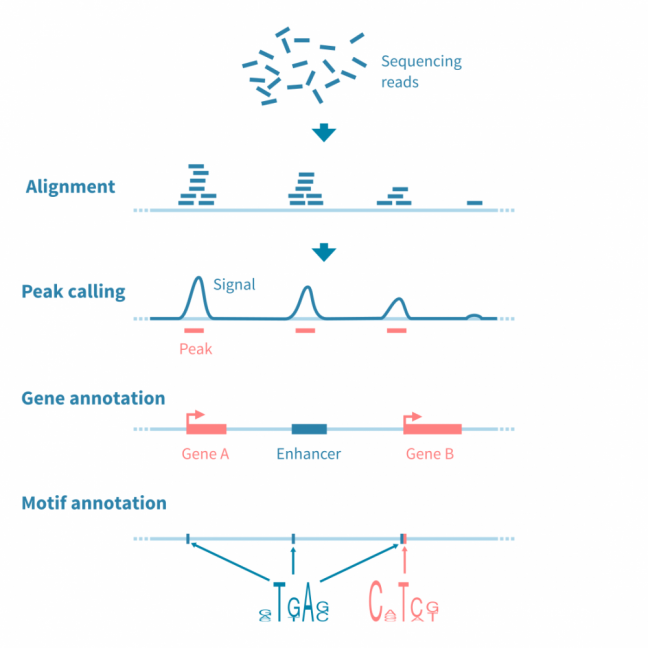
The analysis workflow for most sequencing-based epigenomic data (particularly ChIP-seq, ATAC-seq and related experiments) involves identifying, annotating and analysing peaks, or genomic regions with signal of interest.
The raw sequencing reads are first quality-controlled and aligned to a reference genome, after which possible control libraries (pre-IP input and IP with non-specific antibody, in the case of ChIP-seq) are used to normalize the read coverage signal.
Peaks in the signal are identified using a peak caller tool. This phase may require careful parameter tuning to optimize the analysis to the used protocol.
To enable further analysis, peaks are annotated with relevant information such as read statistics, and near or overlapping features such as genes, regulatory elements and binding motifs.
Annotating peaks with genes enables gene set enrichment analyses for further interpretation of downstream effects.
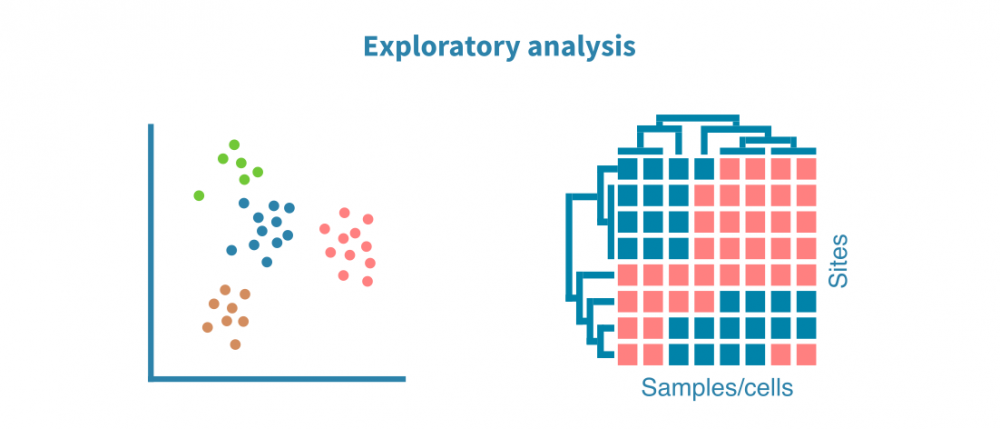
Exploratory analysis
Annotated peaks across the sample set are visualized using PCA (and UMAP or t-SNE algorithms for single-cell data) and heatmaps. These visualizations help in optimizing the peak calling process and answer questions such as:
- Do the biological replicates resemble each other with regards to their epigenomic profiles?
- Do distinct sample groups (e.g., different tissues, treatments or time points) form separate clusters?
- Are there outlier samples?
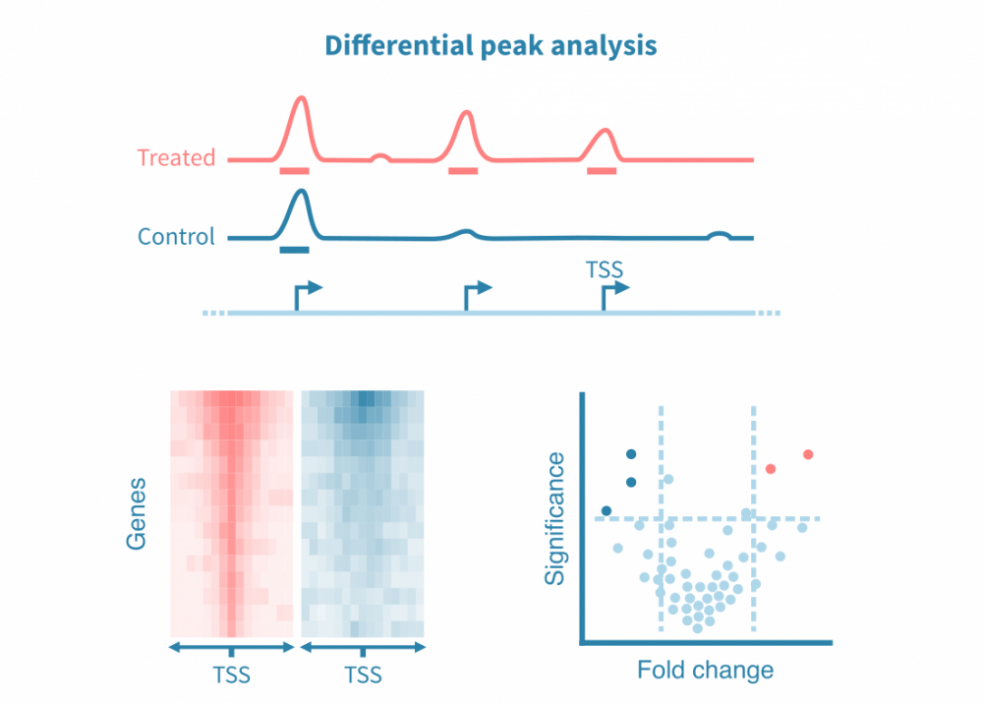
Differential peak analysis
To compare different conditions, the identified peaks can be statistically compared — or, more commonly, differential peaks can be directly called from the respective read coverage signals.
Similar to differential gene expression analysis, differential peak analysis yields estimates on the effect size and statistical significance. These statistics can be visualized as a volcano plot.
As genome-wide epigenomic measurements yield a continuous signal across the genome, such analyses may also focus on specific regions of interest, such as promoters or known binding sites of a protein of interest. Density heatmaps are used to visualize the signal at sites of interest in different conditions.
Furthermore, overlapping binding motifs at the peaks can be statistically compared between conditions and visualized as volcano plots.
Transcription factor binding site analyses
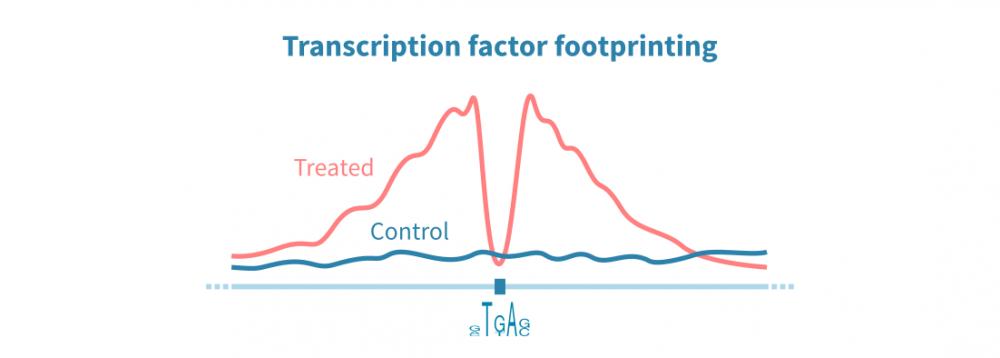
ChIP-seq and related protocols can be used to identify transcription factor (TF) binding sites across the genome. Such assays rely on antibodies specific to the protein of interest, and this approach thus enables identifying binding sites of just one TF. ATAC-seq data, on the other hand, can be used to identify binding sites of all DNA-bound proteins in parallel, through an analysis called TF footprinting.
In TF footprinting, narrow drops in the chromatin accessibility signal are interpreted as protein binding sites. The identity of the TF may be indirectly inferred from binding motifs. Coupled with RNA-seq data, TF footprinting can be used to study the combined effects of TFs on gene expression in a very high-throughput manner.
DNA methylation data analysis
The analysis of DNA methylation data starts with the quality control and alignment of sequencing reads (or QC and normalization of array data), and proceeds to calling the methylated sites.
Detected methylated sites are used to identify larger regions of DNA methylation or differentially methylated regions (DMRs) between samples. These regions can be annotated similarly as peaks in other epigenomic data.
Possible downstream analyses for DNA methylation data include:
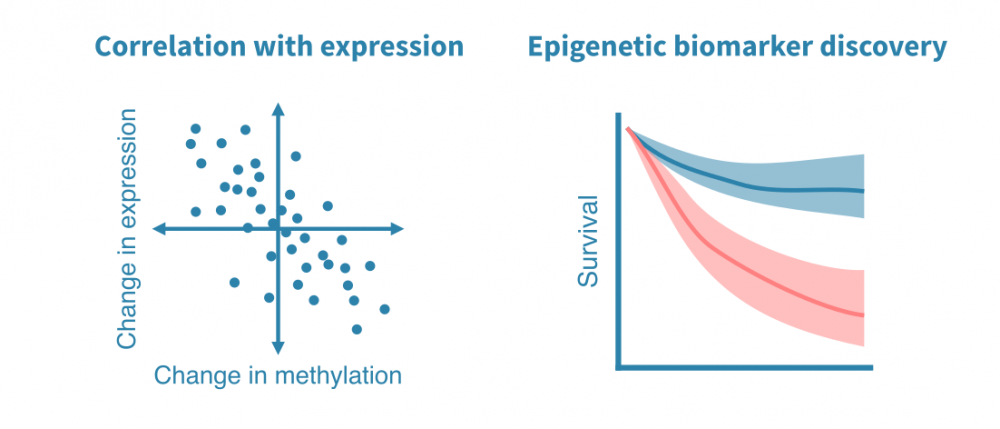
- Integration with gene expression data. When RNA-seq or other gene expression data is available from the same setting, the association of promoter methylation and gene expression can be studied.
- Epigenetic biomarker discovery. DNA methylation data from patient samples enables discovering clinically revelant epigenetic markers.
- Biological age analysis. Epigenetic models of biological aging have been developed for DNA methylation data. Such models can be used to estimate the biological, as opposed to chronological, age of an individual or specific tissue within an individual.
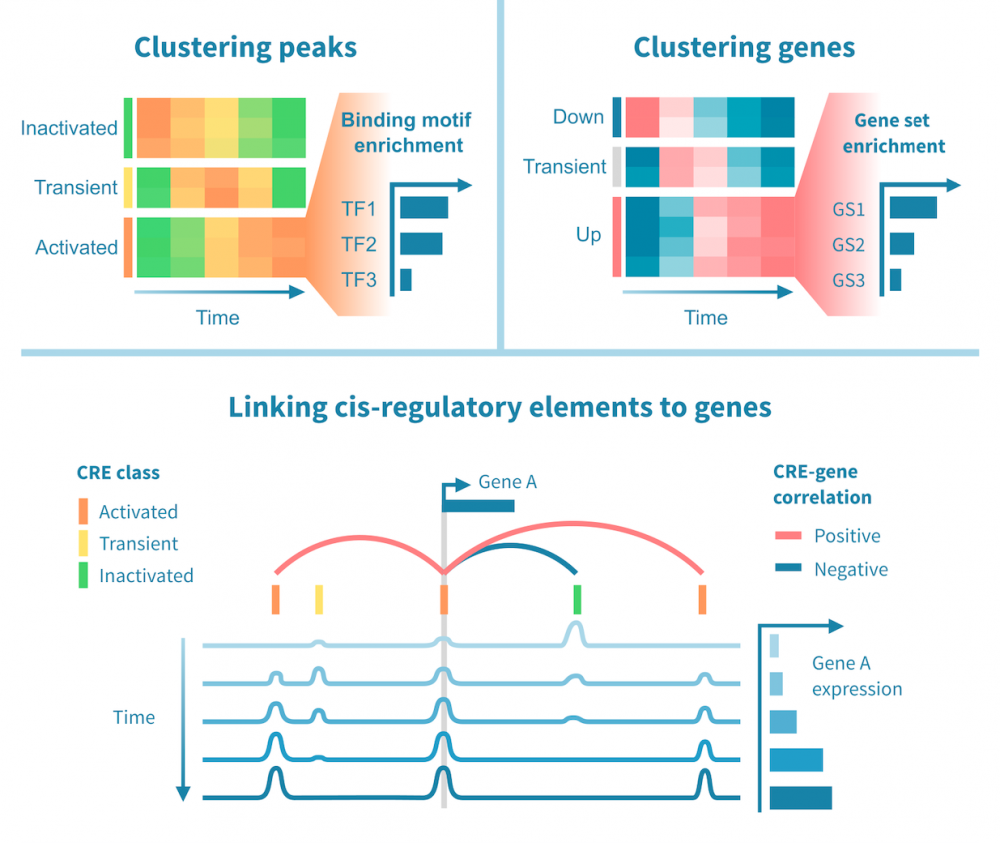
Integrating RNA-seq and epigenomic data
Performing RNA-seq and epigenomic sequencing (such as ChIP or ATAC-seq) on the same samples enables integrative analyses to study gene regulatory programs genome-wide.
Regulatory connections can be identified between enhancers and their target genes, as well as transcription factors and their targets, building on evidence from both gene expression and the epigenomic status of regulatory elements.